



A bear flag is a bearish continuation chart pattern. A sharp, near-vertical drop forms the “flagpole,” then a small, upward-drifting consolidation forms the “flag.” When price breaks down below the flag, the prior downtrend is expected to resume — and the standard target is a move equal to the height of the flagpole, projected down from the breakdown.
It is the mirror image of the bull flag and one of the more common continuation patterns in technical analysis, appearing across stocks, forex, and crypto on every timeframe. This guide covers what a bear flag is, the psychology that drives it, how to spot a valid one, exactly how to trade the breakdown, how the bear flag differs from a bull flag, and the mistakes that turn a textbook setup into a losing trade.
What is a bear flag pattern?
A bear flag is a chart pattern that signals a brief pause inside an existing downtrend before that trend continues lower. It has two parts that give it its name:
- The flagpole — a steep, fast, near-vertical drop in price, often 10–20% in 3–8 bars. This is the strong selling thrust that starts the pattern. The straighter and longer the pole, the stronger the signal.
- The flag — a small, tight consolidation that forms after the pole, usually drifting slightly up or sideways against the prevailing downtrend, bounded by two roughly parallel trendlines. It looks like a little flag hanging off the bottom of the pole.
When price breaks down below the lower trendline of the flag, the pattern is considered complete and the downtrend is expected to resume. Because the move that preceded the flag was down, this setup is a continuation pattern, not a reversal — it tells you the trend is more likely to keep falling than to turn around.
A key distinction: the “flag” part must attach to a real flagpole. As pattern researcher Thomas Bulkowski puts it, if you don’t have a straight-line, quick price run leading into it, “then you don’t have a flag” — just a sideways congestion area. The pole is what gives the pattern its momentum and its measured target.
The anatomy of a bear flag: flagpole, flag, and breakdown
Every valid flag moves through the same three stages, and volume tells you as much as price does:
- The flagpole (sharp sell-off, rising volume). A burst of selling drives price down quickly, often 10–20% in just 3–8 bars. Volume is typically high and expanding — frequently 2–3× the 20-day average — and this is the downside momentum the rest of the pattern lives off of.
- The flag (tight drift up, contracting volume). Sellers pause and some short-sellers take profits, so price drifts gently higher or sideways in a narrow channel, usually giving back less than 50% of the pole. Crucially, volume dries up during the pause — often to half its flagpole peak. That contraction is the tell: buyers aren’t aggressive, they’re just a brief relief bounce.
- The breakdown (expansion again). Price pushes back below the flag’s lower trendline, ideally on a fresh surge in volume. That renewed selling confirms the setup and the downtrend resumes.
The whole flag portion is short — Bulkowski’s identification rule is that flags last less than about three weeks; anything longer is usually a rectangle or channel, not a flag. A tight, well-behaved flag on a steep pole is the ideal.
The psychology behind the bear flag
The shape is not arbitrary — it maps directly onto crowd behavior.
The flagpole is a wave of fear: a catalyst (a bad earnings miss, an analyst downgrade, a broken support level) sends sellers rushing for the exit, and price collapses 10–20% in just a few sessions. After a move that fast, some short-sellers lock in profits and bargain-hunters step in looking for a bottom — nobody wants to short a market that has already fallen vertically. That short-covering and dip-buying creates the flag: a modest bounce that typically recovers less than 50% of the drop over 5–15 bars.
But notice what doesn’t happen. Despite a hard sell-off, price fails to recover very far. Sellers keep leaning on every small rally near a zone of overhead supply, capping the bounce. The tightness of the flag and the fading volume both say the same thing — buyers have little conviction, and the pause is just the market catching its breath before the next leg down. When the relief bounce runs out of buyers, it takes only a small spark of fresh selling to push price out of the flag and resume the trend. Reading that balance of conviction is a skill worth pairing with the discipline covered in our guide to trading psychology.
How to identify a valid bear flag
Most failed bear-flag trades come from calling a pattern “valid” when it isn’t. Use these filters.

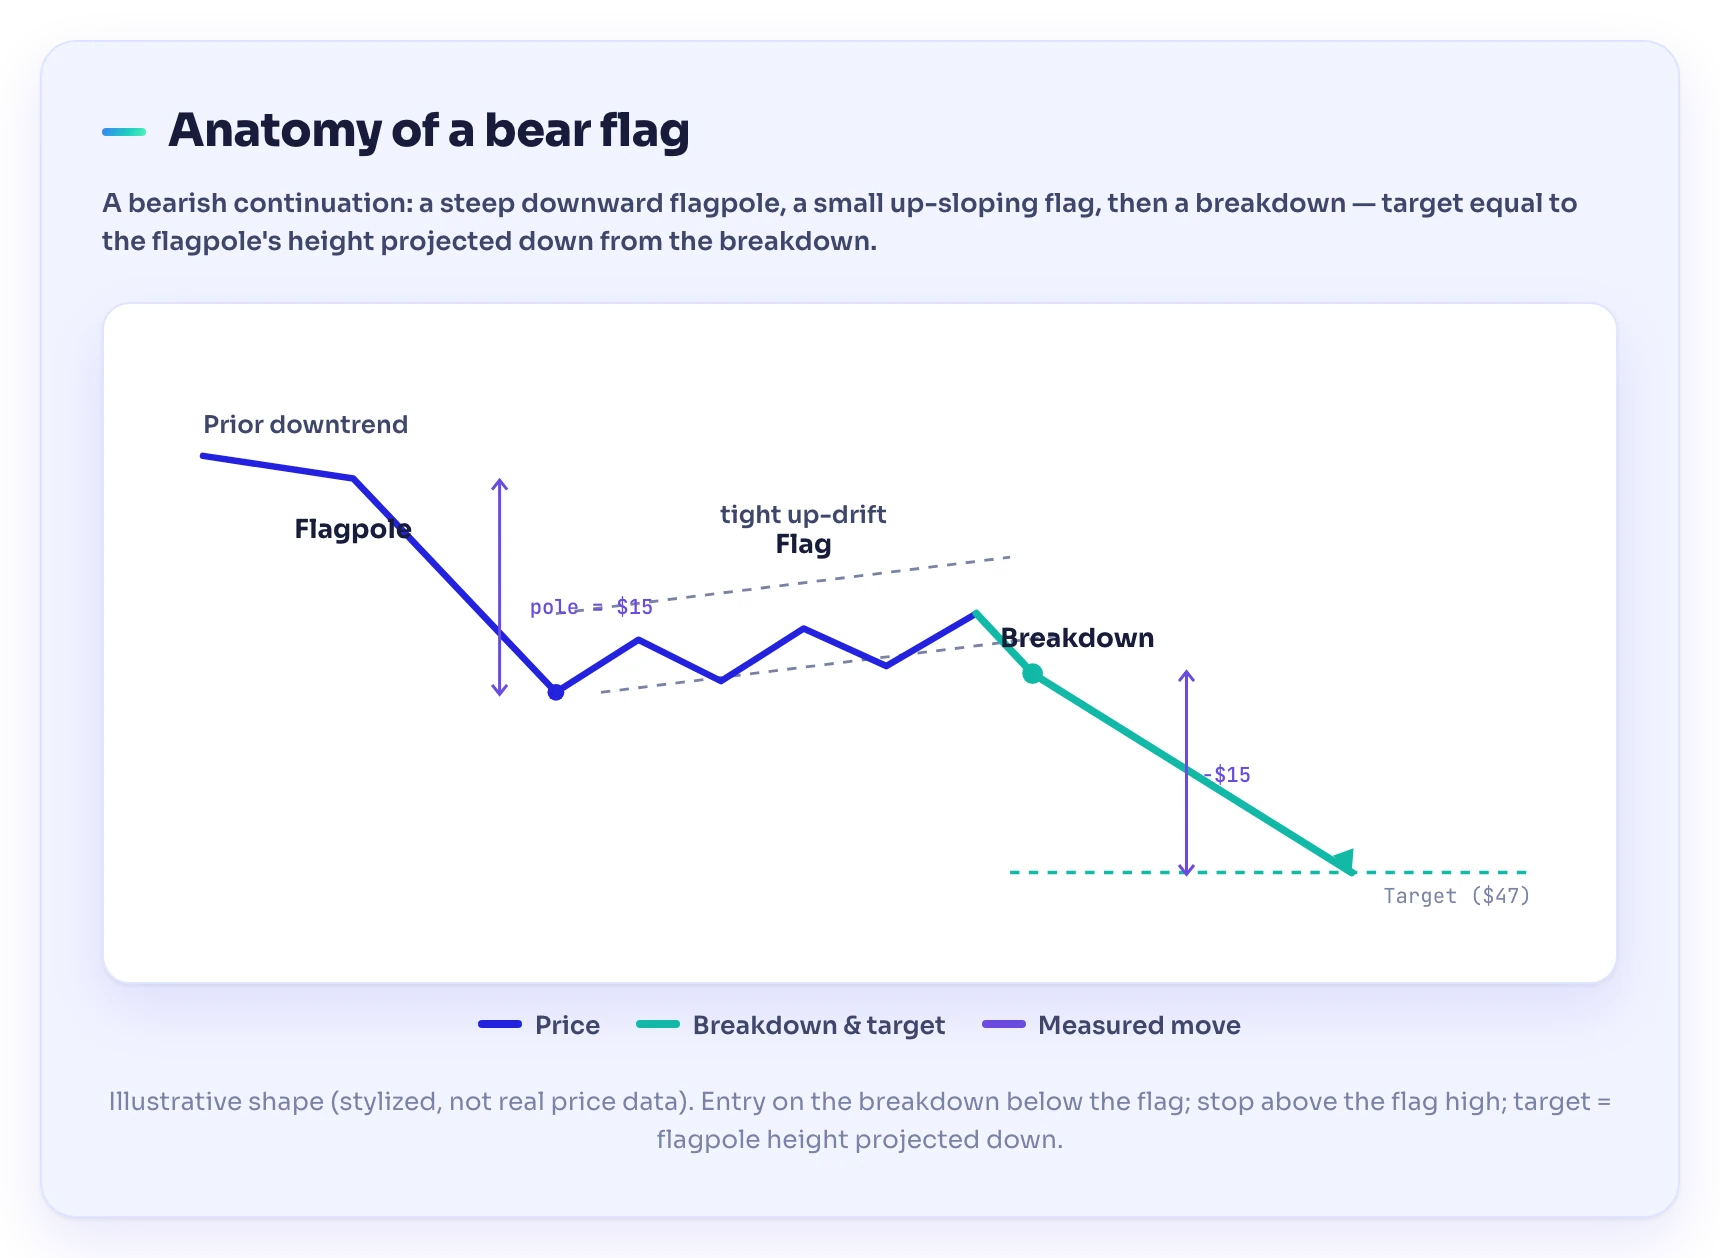
An illustrative bear flag: a steep downward flagpole, a tight upward-sloping flag, then a breakdown with a target equal to the flagpole’s height projected down from the breakdown. Stylized shape for teaching — not real price data.
The flagpole:
- Steep and fast. The pole should be an unusually sharp, near-straight-line drop lasting several bars. A slow, sideways decline is not a flagpole, and a weak pole means a weak move after the breakdown.
- Strong volume. Expanding volume into the pole confirms genuine selling pressure behind the move.
The flag:
- Small and tight. The flag should be a modest bounce, not a full recovery. A useful sanity check: the flag generally shouldn’t retrace past the midpoint of the flagpole. A bounce that gives back most of the pole isn’t a flag — it’s a possible reversal.
- Parallel trendlines, slight upward slope. Price should ride between two roughly parallel lines, usually tilting up against the downtrend. Bulkowski’s research found the best performance comes when a flag tilts against the prevailing trend.
- Contracting volume. Volume should fade through the flag. In Bulkowski’s study, volume trends downward through the flag about 77% of the time before a downward breakout (and 74% before an upward one) — falling volume is the confirmation that buying is drying up.
- Short duration. A few days to about 3 weeks (roughly 21 trading days), not months. Bulkowski clips the flag identification window at 21 days for exactly this reason.
The breakdown:
- Close below the flag’s lower trendline, ideally on a clear jump in volume. A breakdown on weak volume is the classic trap — without sellers behind it, price often climbs back into the flag.
Tight beats loose. A tight flag — clean parallel lines, little white space, no jagged pokes outside the channel — is statistically a better performer than a loose, messy one.
How to trade the bear flag pattern
Once you have a valid pattern, the trade has three mechanical parts: entry, stop, and target.
1. Entry — the breakdown. The trigger is a close below the lower trendline of the flag, ideally on rising volume. Two common styles:
- Breakdown entry: sell/short as price closes below the flag. Simplest, but occasionally catches a false breakdown.
- Retest entry: wait for the breakdown, then for price to pull back up to the broken trendline (now acting as resistance) and stall — often within 1–3 bars. Lower risk, and it can tighten the stop to under 1% of price, but you sometimes miss the move.
2. Stop-loss. Place the stop above the high of the flag. If price climbs back over the flag, the continuation logic has failed and the setup is void. This keeps the risk small and defined.
3. Target — the measured move. The standard bear-flag target is the height of the flagpole, projected downward from the breakdown point. Measure the pole from its top to its bottom, then subtract that distance from the price where you entered.
Bear flag vs bull flag
The bear flag and the bull flag are the same idea in opposite directions. Both are continuation patterns — a sharp move, a pause, then more of the same — but every element flips.

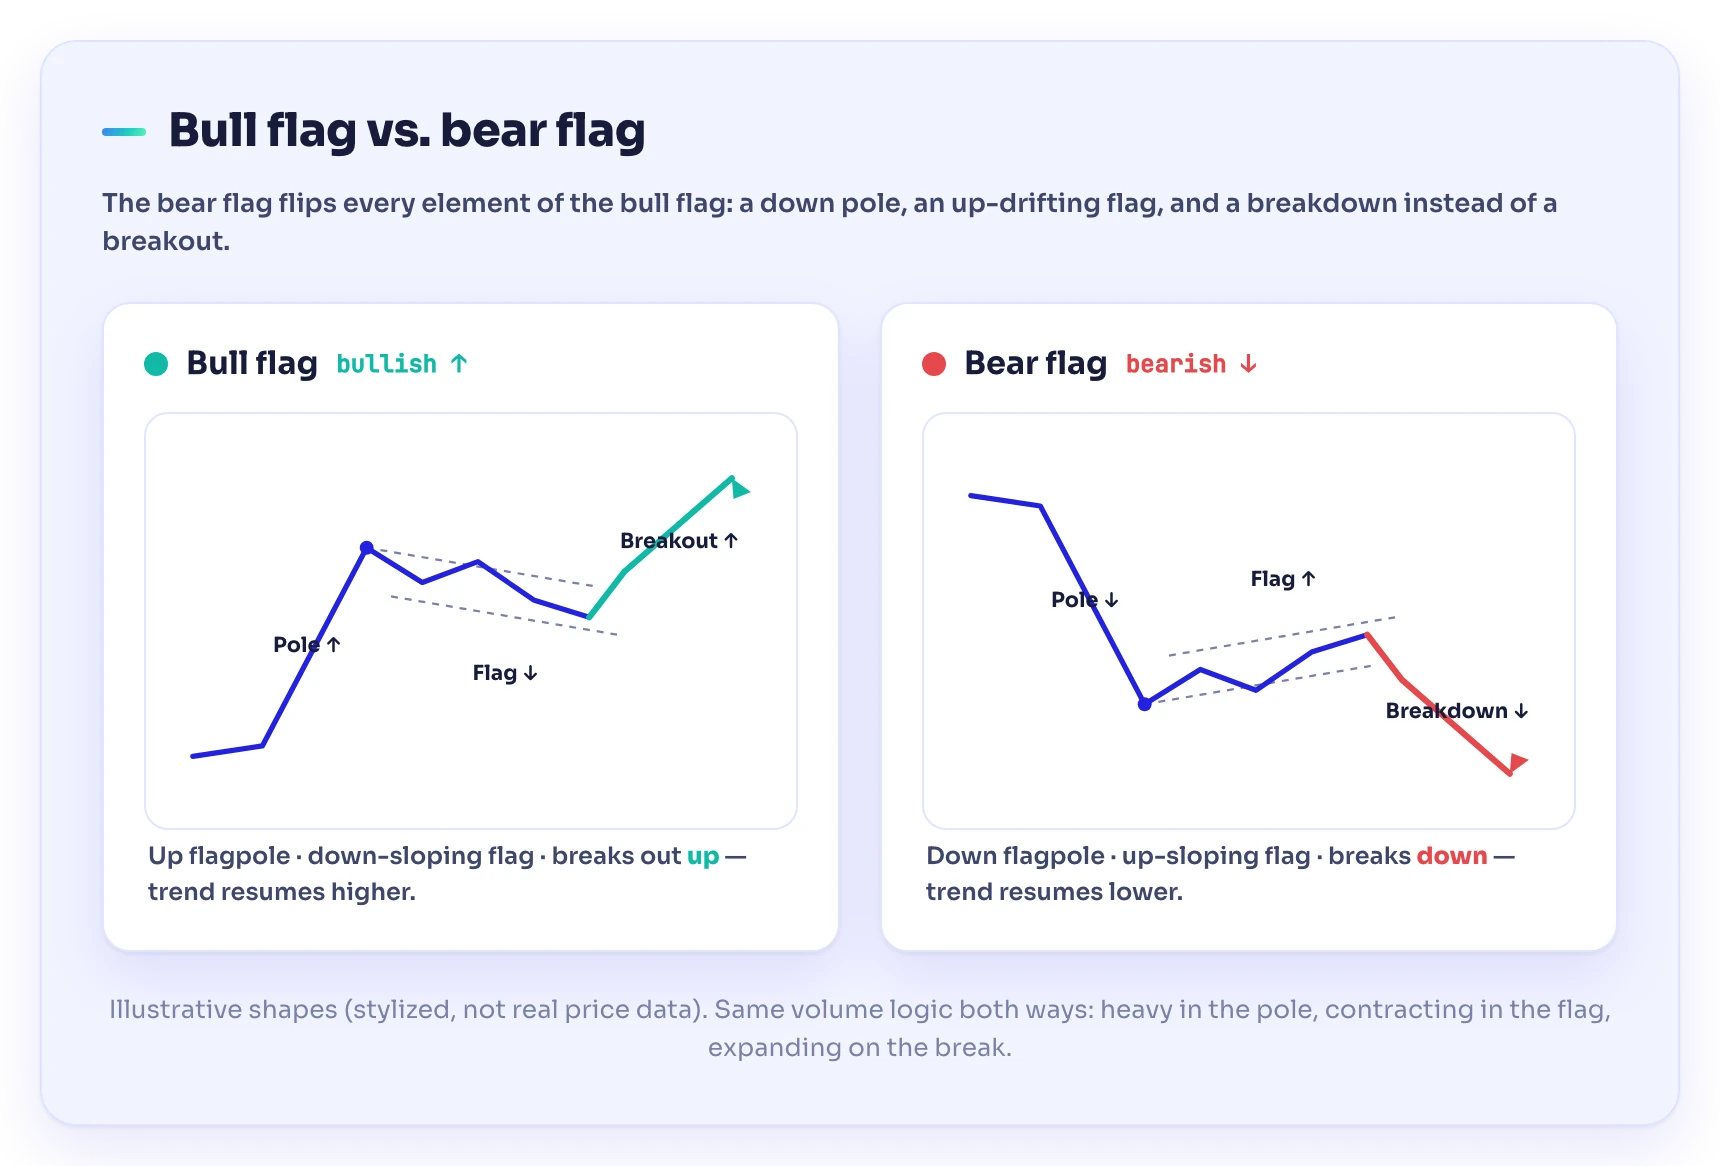
Bull flag versus bear flag: the bear flag flips every element — a downward pole, an upward-drifting flag, and a breakdown instead of a breakout. Stylized shapes for teaching, not real price data.
| Element | Bull flag | Bear flag |
|---|---|---|
| Prevailing trend | Uptrend | Downtrend |
| Flagpole direction | Sharp move up | Sharp move down |
| Flag slope | Drifts down against the trend | Drifts up against the trend |
| Signal | Breakout above the flag | Breakdown below the flag |
| Trade | Buy / go long | Sell / go short |
| Stop | Below the flag low | Above the flag high |
| Target | Flagpole height up from breakout | Flagpole height down from breakdown |
The volume logic is identical in both: high volume in the pole, contracting volume in the flag, and expanding volume on the break. What changes is direction — and the fact that the pattern is often traded on the short side, which is why position sizing and a hard stop matter even more. Traders use it to time short entries or to exit longs in falling markets. For a side-by-side of both against every other formation, keep the chart patterns cheat sheet open while you chart.
Common mistakes and why bear flags fail
No pattern is a guarantee — in Bulkowski’s data, flags resolve downward only about 40% of the time and upward the other 60%, and reach the full measured target just 46% of the time. The usual culprits behind a failed trade:
- No real flagpole. Drawing two lines around a random sideways range and calling it a flag. Without a steep pole, there’s no momentum to continue.
- A flag that’s too tall. If the bounce retraces more than about 50% of the flagpole, sellers have lost control — it’s closer to a reversal than a continuation flag. Keep it under that halfway mark.
- Ignoring volume. A breakdown on weak volume is the single biggest tell of a false move. No volume, no trade.
- Jumping in early. Shorting inside the flag before the breakdown confirms is guessing. Wait for the close below the lower trendline.
- A loose, messy flag. Jagged bounces that poke outside their trendlines are less reliable than tight, clean ones.
- No stop-loss. The pattern’s whole edge depends on covering the trade when the flag high breaks. On a short, an uncapped loss can run further than a long ever could — without a stop, one failed flag can erase several winners.
To sharpen your eye, compare this pattern against its mirror in our bull flag guide and study the full chart patterns cheat sheet alongside it.
Does the bear flag work across markets and timeframes?
Yes — the bear flag is market- and timeframe-agnostic. Because it reflects universal crowd behavior (a momentum drop, a relief bounce, then continuation), it appears on any liquid, chart-able market:
- Stocks — a classic setup on daily and intraday charts of downtrending equities, from 1-minute scalps to weekly swings.
- Forex — common across major and minor pairs; day traders watch it on the 5-minute to 1-hour charts, swing traders on the 4-hour and daily, where a pole might span 30–80 pips.
- Crypto — frequent on Bitcoin, Ethereum, and larger altcoins, but its 24/7 tape and 5–10% daily swings produce messier flags and more false breakdowns, so volume confirmation and a tight stop matter even more.
The rules don’t change by asset or timeframe — only the noise does. On faster, lower-timeframe or more volatile markets, demand cleaner proportions and stronger breakdown volume before you act.
Frequently asked questions
Is a bear flag bullish or bearish?
A bear flag is bearish — it’s a continuation pattern that suggests an existing downtrend will resume after price breaks down below the flag. Its mirror image, the bull flag, is bullish and signals a likely continuation higher.
What is the difference between a bear flag and a bull flag?
They are opposites. A bull flag has an upward flagpole, a downward-sloping flag, and an upward breakout inside an uptrend. A bear flag has a downward flagpole, an upward-sloping flag, and a downward breakdown inside a downtrend. A bull flag is traded long; a bear flag is usually traded short.
How do you set a price target on a bear flag?
Measure the height of the flagpole — from its top to its bottom — and project that same distance downward from the breakdown point. If the pole is $15 tall and you enter the breakdown at $67, the measured-move target is about $52.
Where do you put the stop-loss on a bear flag?
Just above the high of the flag. If price climbs back over the flag, the pattern has failed and the trade should be closed.
How reliable is the bear flag pattern?
Flags are considered among the more reliable continuation patterns, but no chart pattern is a sure thing. In Bulkowski’s statistical studies, flags break in the expected direction roughly 60% of the time (downward about 40%, upward 60%), reach their full measured target only around 46% of the time, and show fading volume through the flag about 77% of the time before a downward break — all within a window of about 21 days. Reliability improves with a steep pole, a tight flag, contracting-then-expanding volume, and a disciplined stop-loss.
What is a flagpole in a bear flag?
The flagpole is the sharp, near-vertical price drop that starts the pattern. It represents the strong selling momentum, and its height is what you use to project the measured-move target.
How long does a bear flag take to form?
The flag portion is short — typically a few days to about three weeks. Consolidations that drag on longer than that are usually classed as rectangles or channels rather than flags.
Keep leveling up
Sources
- Bulkowski, T. N. Flags and Encyclopedia of Chart Patterns, 2nd ed. (Wiley) — the primary statistical reference: flags run less than ~3 weeks off a steep flagpole, tilt against the trend, break out upward 60% / downward 40% of the time, meet the measured-move target ~46% of the time (both directions), and show a downward volume trend within the flag ~74% (up breakouts) to ~77% (down breakouts) of the time; best performance comes from a tight flag tilting against the prevailing trend. thepatternsite.com/flags.html
- Investopedia. Understanding Flag Patterns in Technical Analysis — corroborates the flag-on-a-flagpole definition, the bearish/downtrend variant, the volume behavior, the breakout/breakdown confirmation, and the flagpole-height measured-move target and entry/stop mechanics. investopedia.com/terms/f/flag.asp
Risk warning. Trading stocks, forex, and CFDs carries a high level of risk and may not be suitable for all investors. Short selling in particular can expose you to losses larger than your initial outlay. Chart patterns, including the bear flag, are educational tools, not trading signals, and do not guarantee results. Past performance and illustrative examples do not predict future outcomes. This article is for educational purposes only and does not constitute financial advice.