



Bollinger Bands on stocks are volatility envelopes — a 20-day moving average with an upper and lower band set two standard deviations away — that widen when a stock gets volatile and pinch tight when it goes quiet. For equity traders they do one job especially well: they flag the low-volatility “squeeze” that so often precedes an earnings-driven breakout.
If you want the mechanics from the ground up — the formula, the standard deviation math, the 20-period default — start with our full guide to Bollinger Bands. This article assumes you have that and goes one level deeper: how the bands behave specifically on stocks, where earnings dates, opening auctions, and thinner after-hours liquidity change the picture in ways they don’t for a 24/7 market. We’ll cover the squeeze before a breakout, why price “walks the band” in a strong trend, how to read %b and BandWidth, mean reversion in range-bound large caps, and the confirmation tools that keep you out of the classic traps.
Why stocks change how the bands behave
The band math is identical on any market, but three features of equities shape what the bands show you.
- Scheduled volatility. Stocks have earnings dates, guidance updates, and product events on the calendar. Volatility doesn’t just drift — it collapses into a quiet base ahead of a known catalyst, then explodes. Bollinger Bands, being a direct measure of volatility, map that rhythm almost perfectly.
- Gaps and the opening auction. A stock can close at $100 and open at $92 on an earnings miss. Price can gap clean outside the bands overnight — something a continuously traded market rarely does. A gap beyond the band is not automatically “overdone”; it is often the start of a repricing.
- Session structure and liquidity. Regular US trading runs 9:30–16:00 ET, with thinner pre-market (from 4:00 ET) and after-hours (to 20:00 ET) sessions. Bands drawn on daily candles ignore that, but intraday bands can distort on low-liquidity bars where a few trades swing the standard deviation.
Decode This — What “two standard deviations” really means: The bands sit two standard deviations from the 20-day average, and standard deviation is just a measure of how far recent closes have strayed from that average. When a stock chops around, the deviation is small and the bands hug price. When it makes big daily moves, the deviation grows and the bands flare out. So the band width is not decoration — it is the volatility reading, drawn straight onto the chart.
The squeeze: reading volatility before a stock breakout

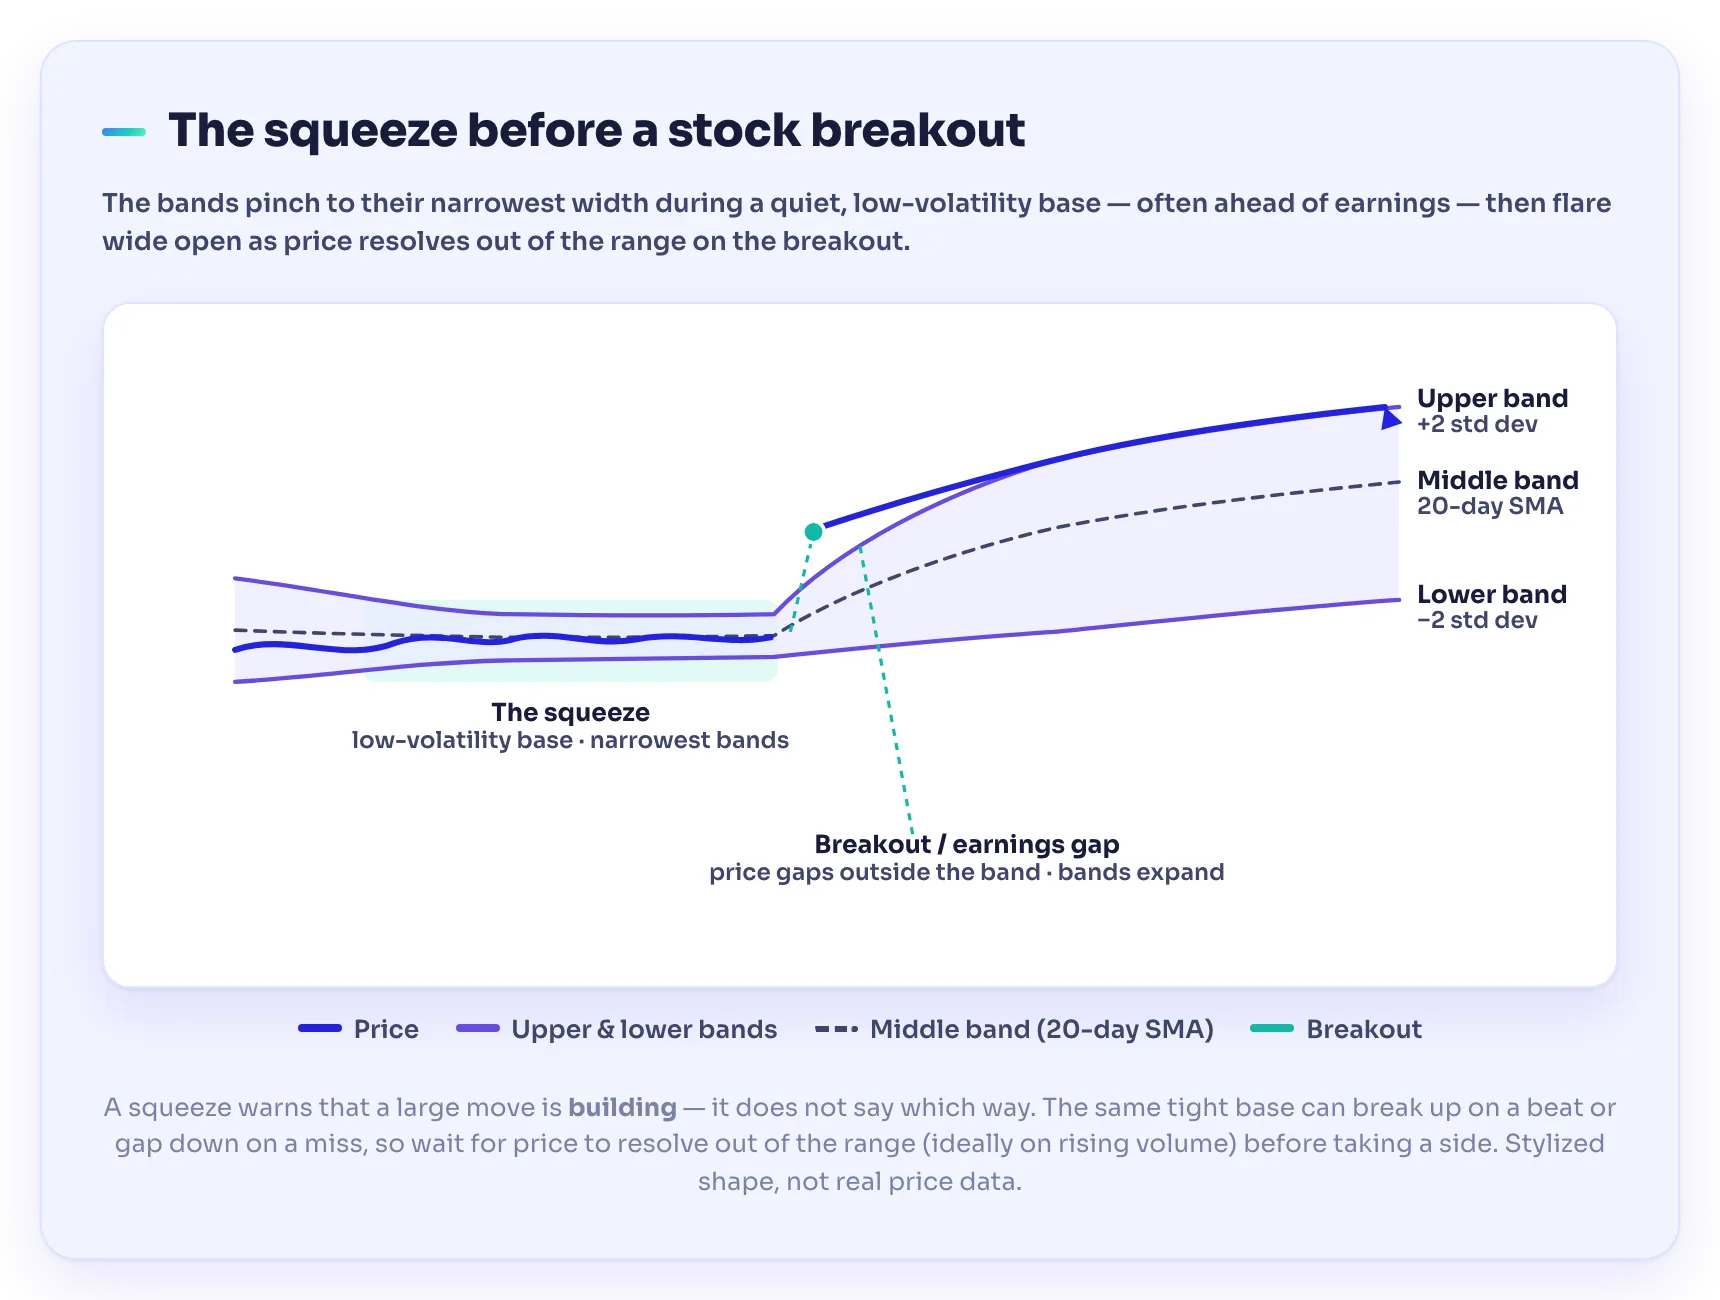
The Bollinger Band squeeze is the setup most stock traders come to these bands for. A squeeze happens when the bands contract to their narrowest width in a long time — John Bollinger’s own definition puts it at the lowest BandWidth in the last 125 trading days. Narrow bands mean volatility has drained out of the stock: buyers and sellers have reached a temporary truce inside a tight range.
That truce rarely lasts. Volatility is mean-reverting — quiet periods tend to give way to active ones — so an unusually tight squeeze warns that a larger move is building. On stocks this often lines up with the calendar: a name coils into a narrow base in the days before earnings, then the report lands and the bands blow open.
The crucial honesty here: the squeeze tells you a move is coming; it does not tell you which way. A stock can break up or break down out of the same squeeze. That is why the squeeze is a setup, not a signal — you wait for price to actually resolve out of the range (ideally on a jump in volume) and trade the direction of the break, rather than guessing beforehand.
Worked Example — a pre-earnings squeeze (illustrative): Numbers below are illustrative, not a real trade. Say a large-cap tech stock trades in a tight $148–$152 channel for two weeks ahead of earnings. BandWidth falls to its lowest reading in six months — a textbook squeeze. Earnings beat, and the stock gaps to $161 the next morning, opening above the upper band as the bands expand sharply. A trader who waited for the resolution takes the long side on the breakout with volume confirming; a trader who “bought the squeeze” the day before could just as easily have been holding into a miss and a gap down to $139. Same squeeze, opposite outcomes — the direction only became knowable when price broke.
Walking the band: why “overbought” fails in a trend
New traders often read a tag of the upper band as “too high, time to sell.” On trending stocks that instinct is expensive. In John Bollinger’s own rules, a tag of the upper band is not in-and-of-itself a sell signal, and a tag of the lower band is not a buy signal — and in trending markets price “can, and does, walk up the upper Bollinger Band and down the lower Bollinger Band.”
Strong stocks do exactly this. A market leader in a powerful uptrend will ride the upper band for weeks, printing a series of closes near or above it while the 20-day average slopes up beneath as support. Every one of those upper-band tags is strength, not a top. The same happens in reverse for a stock in a heavy downtrend hugging the lower band.
So the read flips depending on context. In a clear range, a tag of the upper band is a candidate fade back toward the middle. In a strong trend, that same tag is confirmation the trend is intact. Deciding which regime you’re in — range or trend — is the first question, and it is exactly the kind of context that separates using the bands well from using them badly.
Watch for Traps — the bands describe, they don’t predict: Bollinger Bands are a volatility description, not a forecast. They tell you how stretched or compressed price is right now relative to its recent past — nothing about the future. Technical analysis is probabilistic: a squeeze raises the odds of a move, an upper-band walk raises the odds a trend continues, but none of it is a guarantee, and every one of these patterns fails a meaningful share of the time. Trade them as tilts in your favor with defined risk, never as certainties. Band tags in particular are the single most misread part of the tool.
%b and BandWidth: the two numbers stock traders actually watch

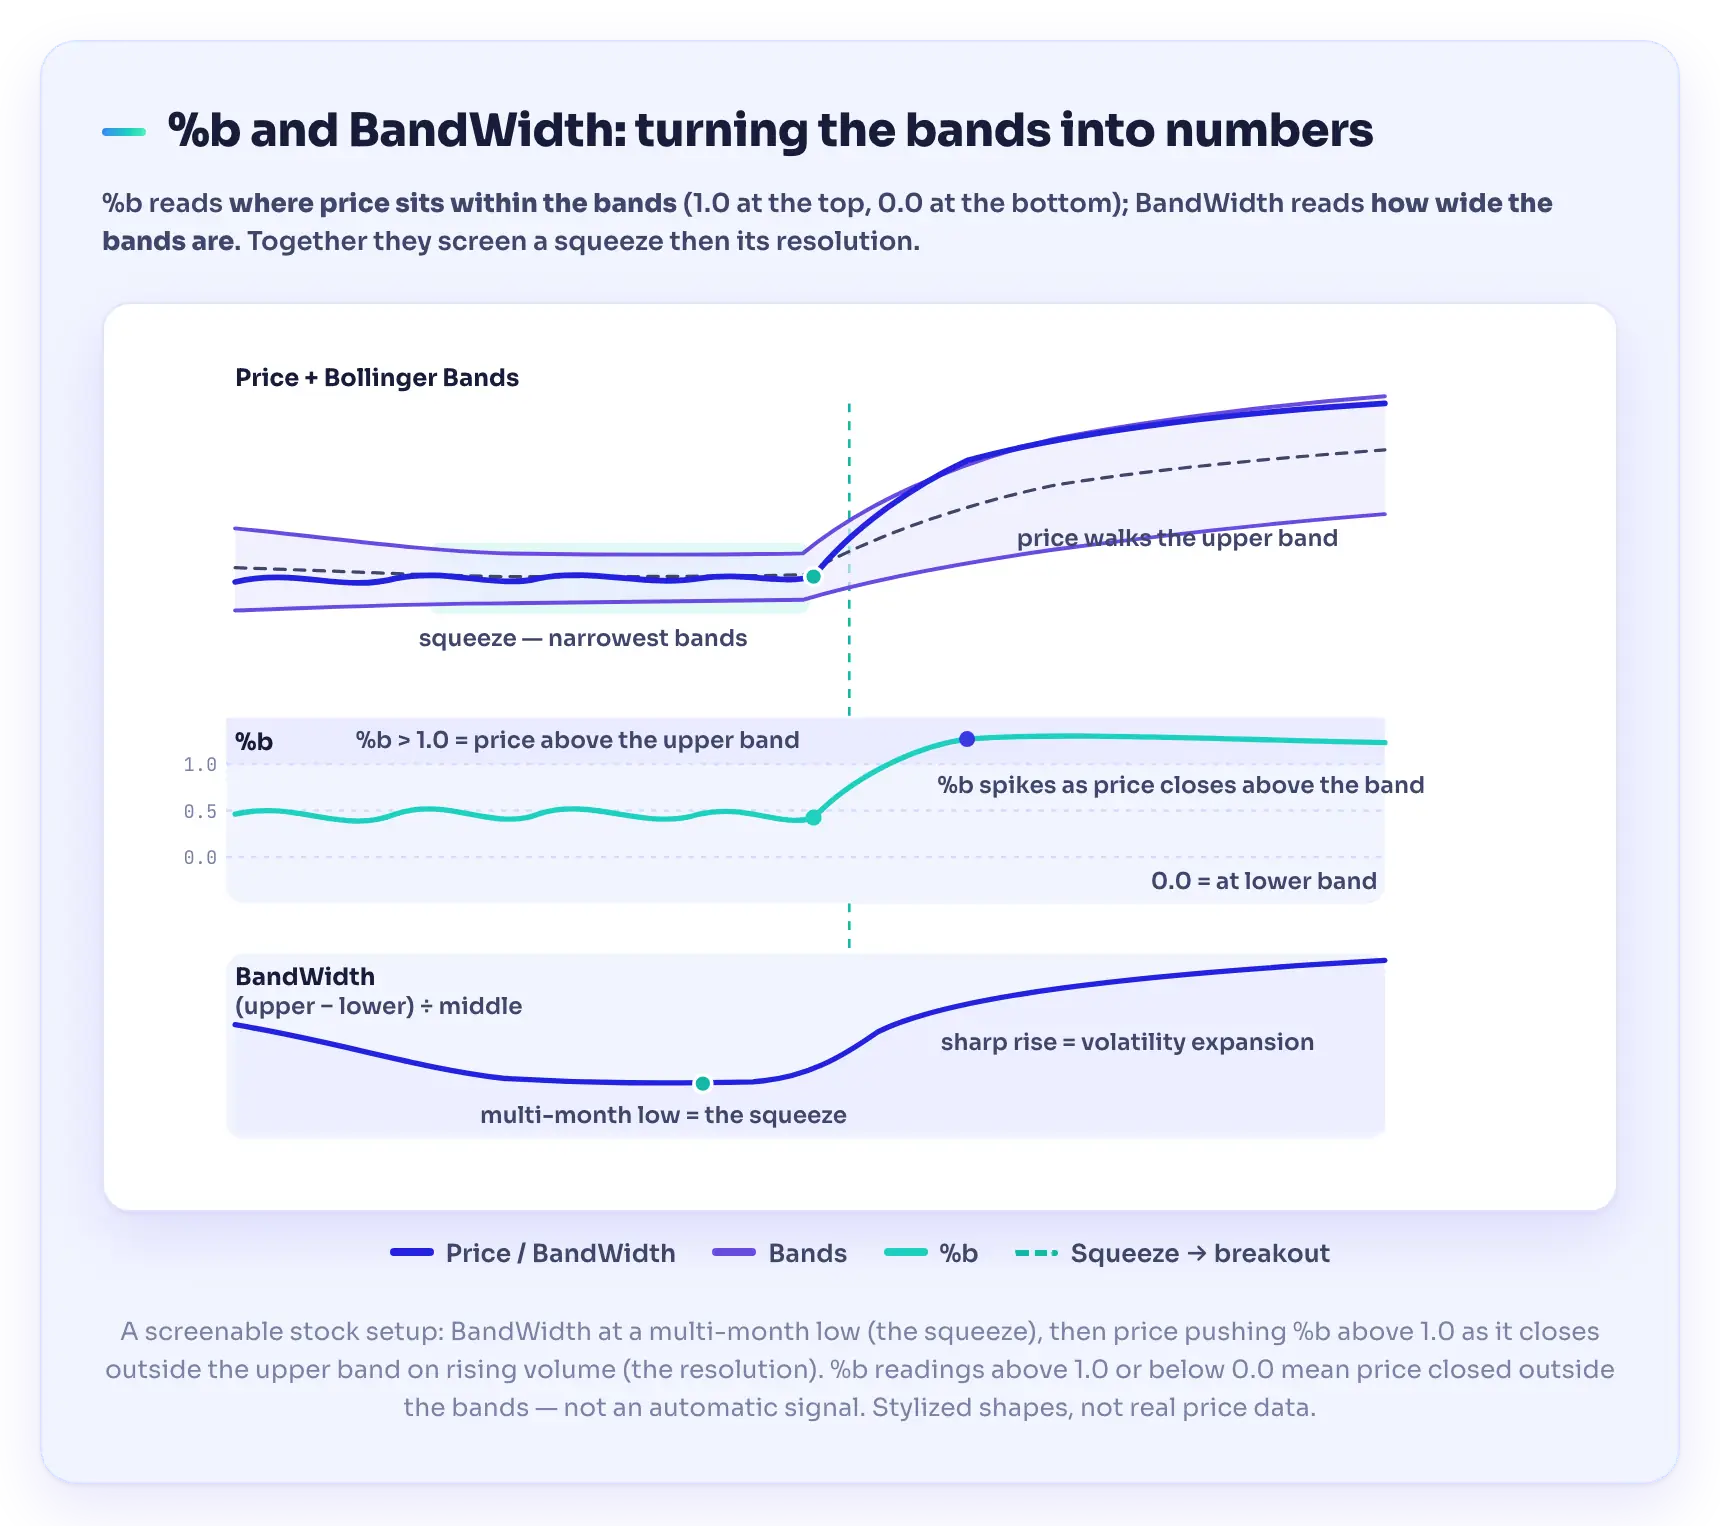
Bollinger built two companion indicators that turn the bands into hard numbers — far more useful than eyeballing tags.
- %b (percent b) tells you where price sits within the bands. It reads 1.0 at the upper band, 0.0 at the lower band, and 0.5 at the middle average. Above 1.0 means price has closed outside the upper band; below 0.0 means it closed below the lower band. For stocks, %b is a clean way to spot divergence: if a stock makes a higher price high but %b makes a lower high, the new high was reached with price less stretched above its average than before — momentum may be fading even as price ticks up.
- BandWidth tells you how wide the bands are, calculated as (upper band − lower band) ÷ middle band. It is the direct squeeze gauge: a BandWidth reading near a multi-month low is the squeeze, and a sharp rise in BandWidth marks the volatility expansion of a breakout.
Used together they answer two different questions at once — how stretched is this stock (%b) and how compressed or expanded is its volatility (BandWidth). A pre-breakout setup you can actually screen for on stocks looks like this: BandWidth at a six-month low (the squeeze), then price pushing %b above 1.0 as the stock closes outside the upper band on rising volume (the resolution).
Checkpoint — settings for stocks: The default of a 20-period simple moving average with ±2 standard deviations is Bollinger’s tested baseline and the right starting point for daily stock charts. If you lengthen the average, widen the deviation slightly (Bollinger suggests ~2.1 at 50 periods); if you shorten it, tighten it (~1.9 at 10 periods) to keep roughly the same share of price inside the bands. Change one variable at a time and confirm it on the timeframe you actually trade — the settings are not where your edge comes from.
Mean reversion in range-bound large caps
Not every stock trends. Mature, heavily traded large caps often spend long stretches oscillating inside a range, and here the bands earn their keep the opposite way — as a mean-reversion guide rather than a breakout trigger.
In a clean, sideways range with roughly flat 20-day average, a tag of the lower band tends to mark the low end of the range and a tag of the upper band the high end, with price reverting toward the middle in between. Traders fade the extremes back toward the average, using the middle band as a logical first target. The catch is knowing you are genuinely in a range and not in the early stage of a trend that is about to walk the band — which is why mean-reversion trades on the bands need a confirming reason to reverse (a rejection candle, a support level, an oscillator turning) rather than a band tag alone.
Pairing the bands with volume and RSI
The bands measure only volatility and relative price position. On their own they cannot tell a genuine breakout from a false one, so the strongest stock setups pair them with a second, independent read.
- Volume is the natural partner for equity breakouts. A close outside the band that comes with a clear surge in volume is far more convincing than one on quiet trade — real breakouts are usually funded by participation. A band break on thin volume is a prime candidate for a fake-out. VWAP is another liquidity-aware reference many equity traders watch alongside the bands intraday.
- Momentum confirms the quality of a move. Pairing %b with the relative strength index (RSI) is a common stock approach: an upper-band tag with RSI still rising supports a continuation read, while an upper-band tag as RSI diverges lower supports the fade. Two independent tools agreeing at the same level is the whole point of confluence in technical analysis.
When the bands, volume, and a momentum tool all point the same way, the odds tilt in your favor. When only the bands do, be skeptical — and remember that the emotional pull of a stock that “looks too high” or “too low” is exactly the trap the bands are so often misused to justify, which is why a little trading psychology work pays off here.
Common Bollinger Band mistakes on stocks
- Selling every upper-band tag. In a trending stock the upper band is where strength lives — fading it fights the trend and gets run over.
- Trading the squeeze early. A squeeze signals a move is coming, not its direction. Wait for price to break out of the range before acting.
- Ignoring earnings. A tight base into an earnings date is a squeeze with a known catalyst and a real gap risk. Size for the gap, or stand aside over the report.
- Reading gaps as instant reversals. A stock can gap far outside the bands and keep going — an outside-band open on a catalyst is often a repricing, not an exhaustion.
- Using the bands alone. No volume, no momentum, no structure — just a band tag — is not a setup. Add a second, independent confirmation.
Where to go next
Bollinger Bands are one lens on a stock: volatility, made visible. They pair naturally with the momentum read of the RSI, the liquidity read of VWAP, and the broader discipline of technical analysis — and they are strongest confirming a level or a catalyst, never acting alone. If you skipped it, the foundational mechanics live in the Bollinger Bands pillar.
Level Up: If you’re building your chart-reading toolkit, a community-led academy like TradeGATEHub — with free trading education and a live academy — is a low-pressure way to practice spotting squeezes and band walks on real stock charts before you risk real money.
The skill is repetition: the more clean squeezes and band-walks you tag on live names, the faster the difference between a breakout and a fake-out starts to read itself.
Frequently asked questions
What are Bollinger Bands on stocks?
Bollinger Bands are volatility bands plotted around a stock’s price: a 20-day simple moving average in the middle, with an upper and lower band set two standard deviations away. The bands widen when the stock is volatile and narrow when it’s quiet, giving equity traders a live read on volatility, stretch, and potential breakouts.
What is a Bollinger Band squeeze?
A squeeze is when the bands contract to their narrowest width in a long time — Bollinger’s definition uses the lowest BandWidth in the last 125 trading days. It signals that volatility has collapsed and a larger move is building. It does not predict direction, so traders wait for price to break out of the range before acting.
Are Bollinger Bands good for stock trading?
They can be a useful tool, especially for spotting the low-volatility squeeze that often precedes earnings-driven breakouts and for gauging whether a stock is trending or ranging. But they measure volatility, not direction, and are probabilistic, not predictive. They work best confirming volume, momentum, and price structure — never traded alone.
Is a tag of the upper band a sell signal on stocks?
No. In John Bollinger’s own rules, a band tag is not in itself a buy or sell signal. In a strong stock uptrend, price can “walk” the upper band for weeks as the trend continues. A tag is a fade candidate only in a clear range — in a trend it’s usually confirmation of strength.
What are the best Bollinger Band settings for stocks?
The standard 20-period moving average with two standard deviations is Bollinger’s tested baseline and a solid start for daily stock charts. If you lengthen the average, widen the deviation slightly (about 2.1 at 50 periods); if you shorten it, tighten it (about 1.9 at 10 periods). Test any change on your own timeframe.
What is %b and how do stock traders use it?
%b measures where price sits within the bands: 1.0 at the upper band, 0.0 at the lower, 0.5 at the middle. Readings above 1.0 or below 0.0 mean price closed outside the bands. Stock traders use %b to spot divergence — a higher price high on a lower %b high can warn that momentum behind a rally is fading.
Sources
- Bollinger, J. — Bollinger Bands Rules (bollingerbands.com, the indicator’s originator). Source for the 20-period / two-standard-deviation default (Rule 9) and the ~2.1 / ~1.9 deviation adjustments at 50 / 10 periods (Rule 11); that a band tag is “NOT in-and-of-itself” a buy or sell signal (Rule 6); that in trending markets “price can, and does, walk up the upper Bollinger Band and down the lower Bollinger Band” (Rule 7); and the definitions of %b (Rule 15) and BandWidth / The Squeeze (Rules 18–19). www.bollingerbands.com/bollinger-band-rules
- StockCharts ChartSchool — Bollinger BandWidth and Bollinger Band Squeeze — reference for the BandWidth formula ((upper − lower) ÷ middle) and Bollinger’s definition of The Squeeze as the lowest BandWidth over roughly the prior 125 periods, where new trends are often born. chartschool.stockcharts.com
Risk warning. Trading and CFDs carry a high level of risk and may not be suitable for all investors. Bollinger Bands are an educational tool, not a trading signal, and do not guarantee results — squeezes, breakouts, and band tags fail a meaningful share of the time, and stocks can gap sharply through the bands on news. This article is for educational purposes only and does not constitute financial advice.