



Candlestick patterns are shapes on a price chart that hint at what buyers and sellers might do next. The technique traces to 18th-century Japan, where rice trader Munehisa Homma charted price this way; analyst Steve Nison introduced it to Western markets in his 1991 book Japanese Candlestick Charting Techniques. Each candle tells a small story about a battle between buyers and sellers, and certain formations recur before reversals or continuations. This guide covers how to read a candle, then the key bullish and bearish patterns every trader should recognize.
The Takeaway
- A candle’s four prices — open, high, low, close — tell you who won the period: buyers or sellers.
- Patterns like the hammer, engulfing, and morning/evening star hint at reversals; the doji flags indecision.
- They are probabilities, not predictions — confirm with the next candle, at a key support or resistance level, on a meaningful timeframe.
The anatomy of a candlestick
Every candle summarizes four prices over its time period: the open, high, low, and close.

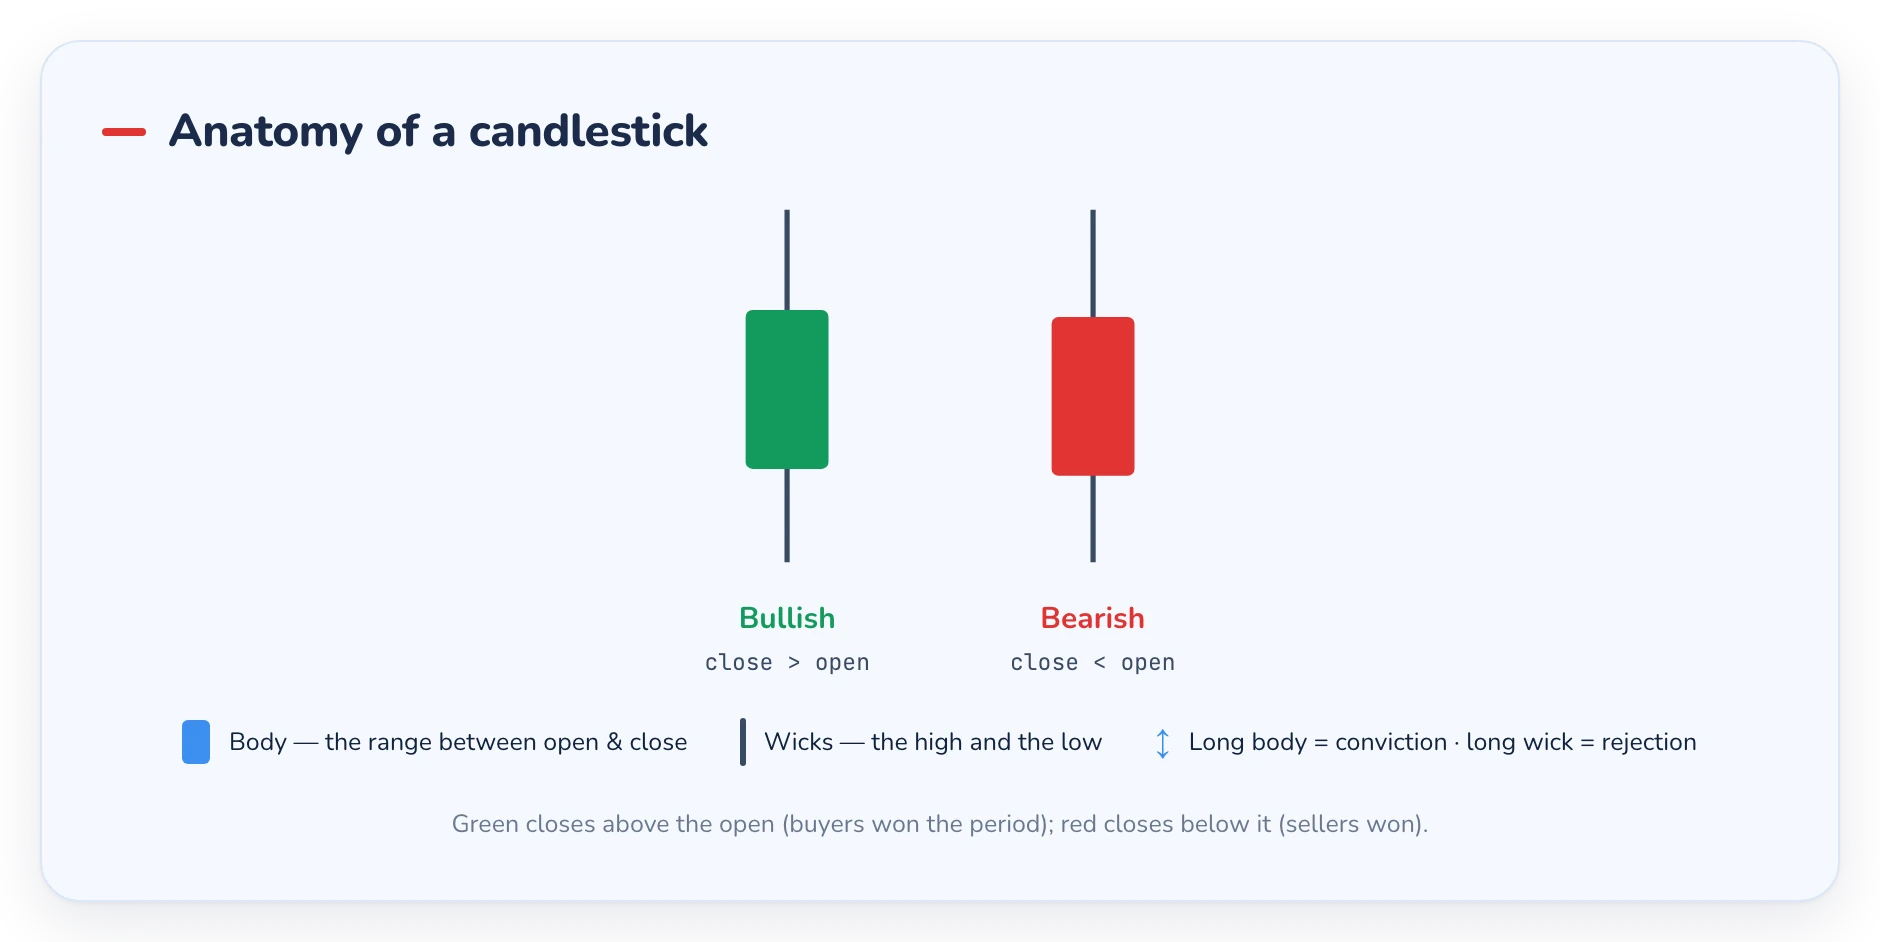
- The body is the range between the open and close. A green (bullish) candle closes higher than it opened; a red (bearish) candle closes lower.
- The wicks (or shadows) are the thin lines above and below, marking the high and low.
- A long body shows strong conviction; a small body shows indecision; long wicks show a move that was rejected.
Read those four points and you can already tell who won the period — buyers or sellers.
Key bullish patterns
These often appear near the bottom of a move and hint at a possible turn up:

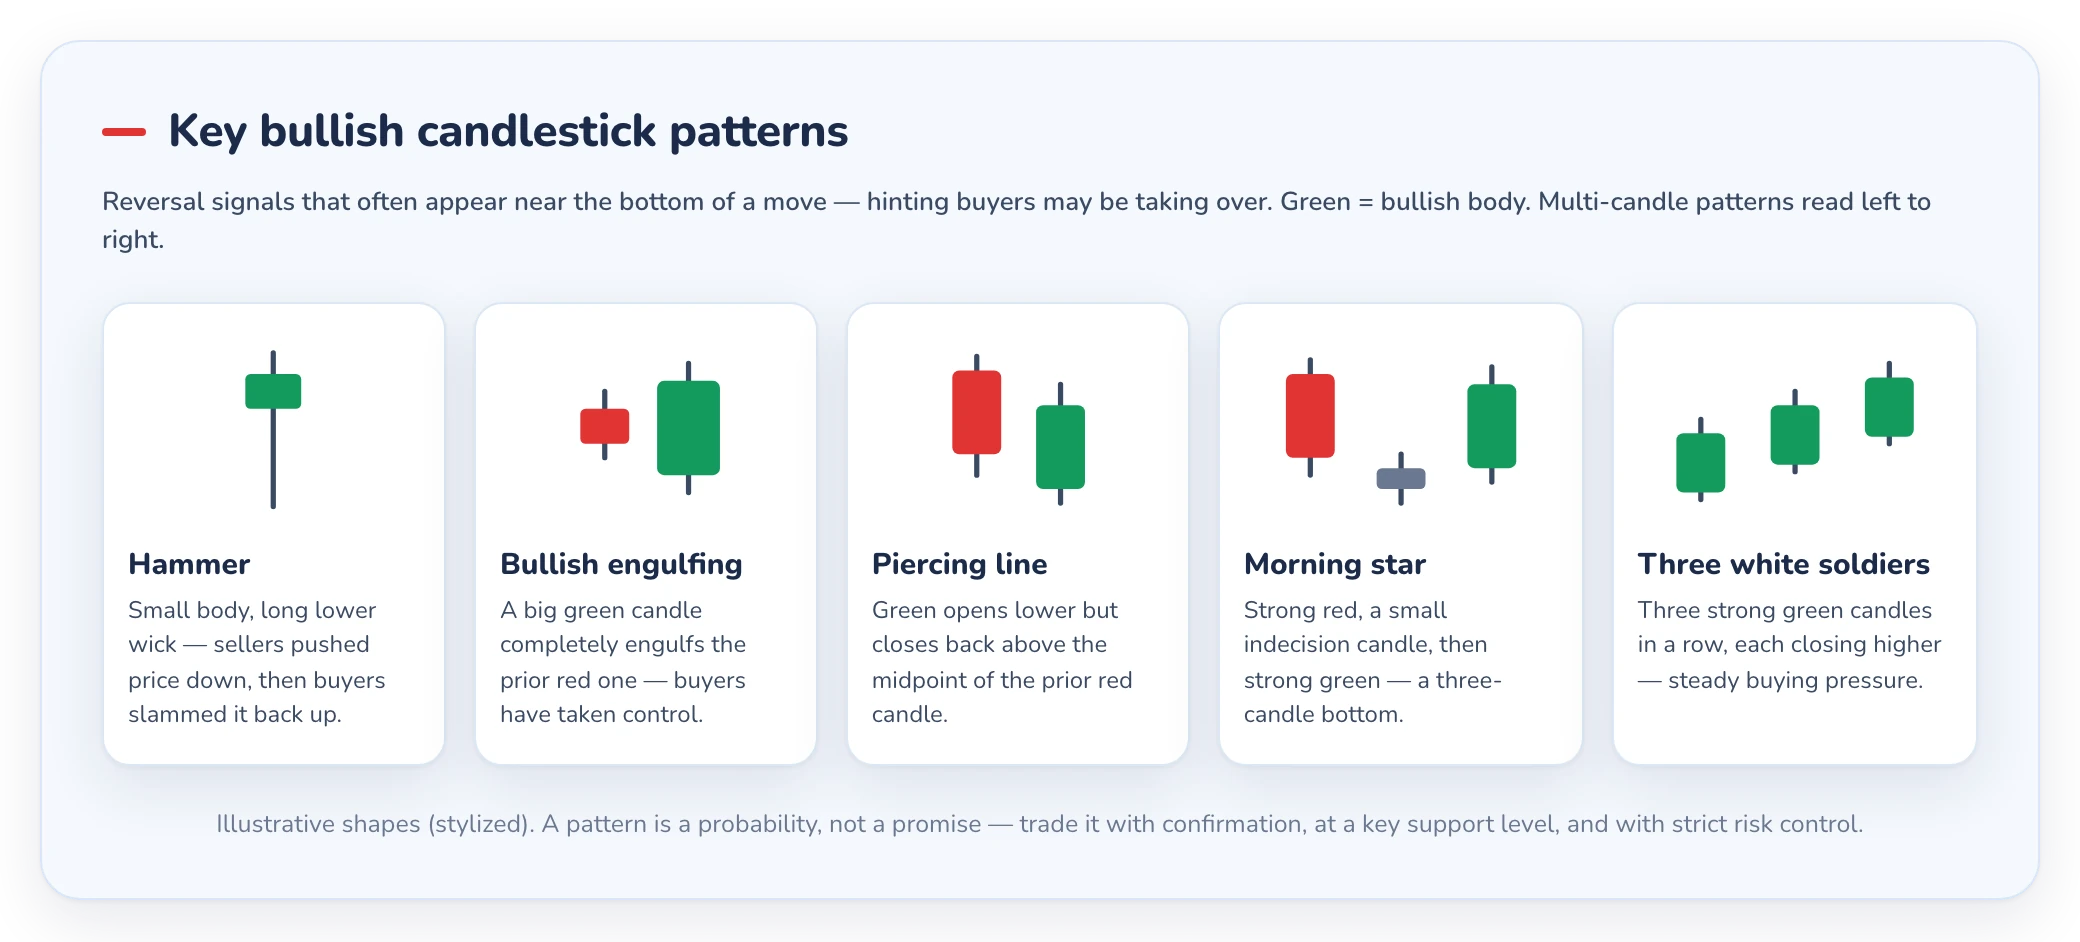
- Hammer. A small body with a long lower wick — typically at least twice the body’s height — where sellers pushed price down before buyers slammed it back up. A classic reversal signal after a downtrend.
- Bullish engulfing. A big green candle that completely “engulfs” the prior red one, showing buyers have taken control.
- Morning star. A three-candle pattern — a red candle, a small indecision candle, then a strong green candle — marking a bottom.
Key bearish patterns
The mirror images, appearing near tops and hinting at a turn down:

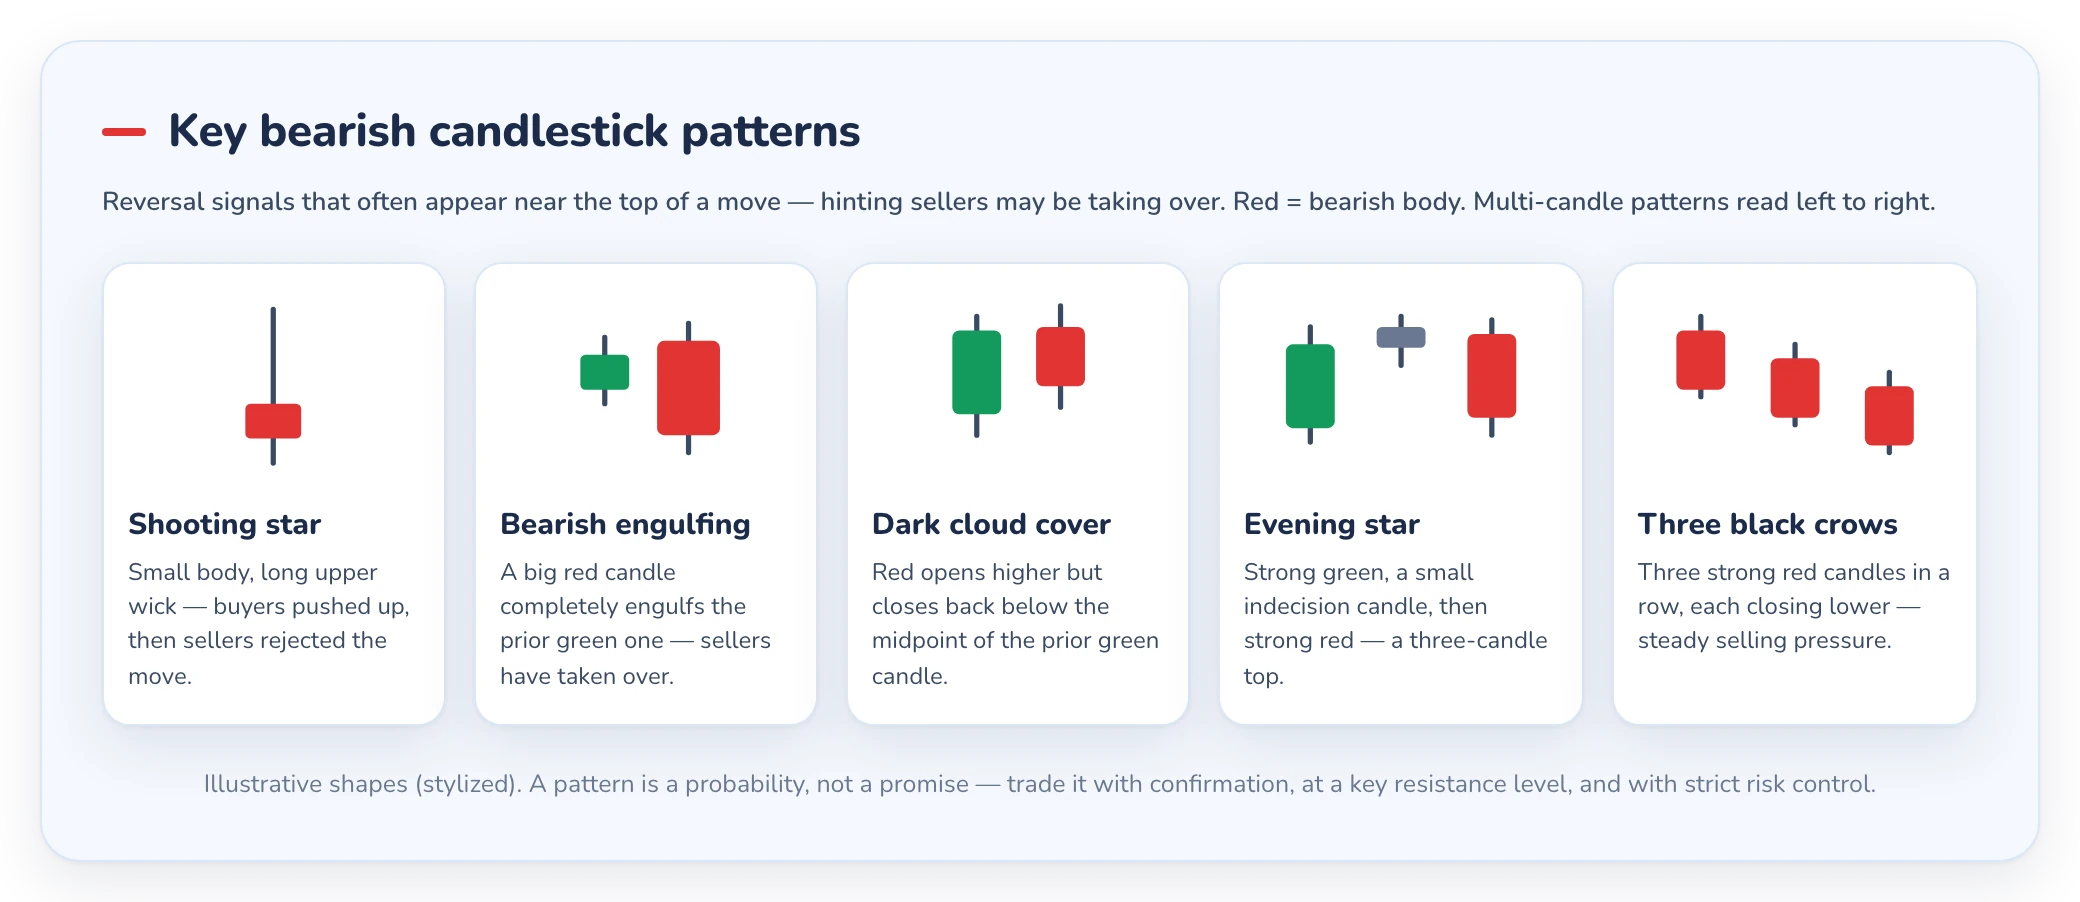
- Shooting star. A small body with a long upper wick — buyers pushed up, then sellers rejected the move. A reversal signal after an uptrend.
- Bearish engulfing. A big red candle that engulfs the prior green one, showing sellers have taken over.
- Evening star. The bearish version of the morning star — green candle, indecision, then a strong red candle marking a top.
Quick-reference: 15 patterns to know
| Pattern | Type | What it hints |
|---|---|---|
| Hammer | Bullish reversal | Sellers rejected; buyers stepped in |
| Inverted hammer | Bullish reversal | Buyers tested higher after a downtrend |
| Bullish engulfing | Bullish reversal | Buyers overwhelm the prior candle |
| Piercing line | Bullish reversal | Buyers close back above the midpoint |
| Morning star | Bullish reversal | Three-candle bottom |
| Three white soldiers | Bullish reversal | Three strong green candles in a row |
| Tweezer bottom | Bullish reversal | Two matching lows reject sellers |
| Shooting star | Bearish reversal | Buyers rejected; sellers took over |
| Hanging man | Bearish reversal | Selling pressure after an uptrend |
| Bearish engulfing | Bearish reversal | Sellers overwhelm the prior candle |
| Dark cloud cover | Bearish reversal | Sellers close back below the midpoint |
| Evening star | Bearish reversal | Three-candle top |
| Three black crows | Bearish reversal | Three strong red candles in a row |
| Doji | Indecision | Neither side won |
| Spinning top | Indecision | Small body, wicks both sides |
Indecision: the doji
A doji forms when the open and close are almost equal, leaving a tiny body with wicks on both sides. It signals a standoff — neither side won. On its own it means little, but after a strong trend it can warn that momentum is fading.
How to actually use candlestick patterns
Patterns are hints, not guarantees. Use them well:
- Wait for confirmation. A single candle rarely justifies a trade — wait for the next candle to confirm the direction.
- Use confluence. Patterns are far stronger at a key support or resistance level than in the middle of nowhere.
- Combine with a strategy. They work best inside a plan, alongside trend and risk rules — see our risk management tools.
- Mind the timeframe. A pattern on the daily chart carries far more weight than one on the 1-minute.
Mind the Undertow
No formation predicts the future. When Thomas Bulkowski back-tested 103 candlestick patterns for his Encyclopedia of Candlestick Charts, most showed only a modest, context-dependent edge — and plenty of “textbook” setups fail outright. A peer-reviewed study of candlestick signals on Dow Jones stocks (Marshall, 2006) found no consistent value at all. Always trade with a stop-loss and manage risk on every position.
A worked example
Say a stock falls for five straight days, then prints a hammer — a small body with a lower wick about twice the body’s length, closing near the day’s high. On its own, that’s only a hint. You wait for the next candle: if it closes green above the hammer’s high, buyers have likely taken control. You enter there, place a stop just below the hammer’s low (say 2% away), and target twice your risk. If instead price closes back below the hammer, the signal failed and you stand aside. That confirmation step — not the pattern alone — is what turns a guess into a disciplined trade.
Practice reading candles
Paddle Out
The fastest way to learn candles is to watch them form in real time on a demo account. Tradeview Markets offers demo and live charting on the MetaTrader and cTrader platforms — so you can spot these patterns live before risking real money. New to charts entirely? Start with what is trading and how to start trading.
Frequently asked questions
What are candlestick patterns used for?
To read market sentiment and anticipate possible reversals or continuations. Each candle shows the battle between buyers and sellers; recurring patterns hint at what may come next.
How do you read a candlestick?
Look at the body (open to close) and the wicks (high and low). A green body means the close was higher than the open (buyers won); a red body means the opposite. Long wicks show rejected moves.
Are candlestick patterns reliable?
They’re useful hints, not certainties. Many patterns fail, especially on low timeframes. They work best with confirmation, at key levels, and inside a broader strategy with strict risk control.
What is the most reliable candlestick pattern?
Engulfing patterns and the hammer/shooting star are among the most widely watched reversal signals — but “reliable” always depends on context, timeframe, and confirmation.
How many candlestick patterns are there?
More than 100 have been formally catalogued, but you don’t need them all. Mastering a handful — hammer, engulfing, morning/evening star, and doji — covers most of what beginners need.
Sources
- Marshall, B. R., Young, M. R., & Rose, L. C. (2006). Candlestick technical trading strategies: Can they create value for investors? Journal of Banking & Finance, 30(8), 2303–2323 — found candlestick signals had no consistent value on DJIA stocks. doi.org
- Barber, B. M., & Odean, T. (2000). Trading Is Hazardous to Your Wealth: The Common Stock Investment Performance of Individual Investors. The Journal of Finance, 55(2), 773–806. doi.org
Risk warning. Trading Forex and CFDs carries a high level of risk and may not be suitable for all investors. Candlestick patterns are educational tools, not trading signals, and do not guarantee results. This article is for educational purposes only and does not constitute financial advice.