



The cup and handle pattern is a bullish continuation chart pattern. Price forms a rounded, U-shaped consolidation (the cup), then a small downward drift (the handle), before breaking out above resistance to continue its prior uptrend. Traders enter on the breakout, targeting a move roughly equal to the cup’s depth.
It is one of the most recognizable formations in technical analysis, and it shows up across stocks, forex, and crypto. This guide covers what the pattern is, how it forms and why, how to identify a valid one, exactly how to trade it, the inverted (bearish) version, and the mistakes that turn a textbook setup into a losing trade.
What is a cup and handle pattern?
A cup with handle is a chart pattern that signals a pause inside an existing uptrend before the trend resumes. It has two parts:
- The cup — a rounded, U-shaped consolidation. After an advance, price drifts lower, carves out a gently curved bottom, and grinds back up to roughly the level where the decline started. That smooth, bowl-like shape is the “cup.”
- The handle — a smaller, shorter pullback that forms on the right side of the cup, just below the prior high. It usually slopes slightly down or sideways, like the handle on a teacup.
When price breaks out above the resistance line running across the top of the cup, the pattern is considered complete and the prior uptrend is expected to continue. Because the move that preceded the cup was up, the formation is classed as a continuation pattern, not a reversal.
The formation was defined by American investor William J. O’Neil in his 1988 book How to Make Money in Stocks, where it forms the core “base” of his seven-part CAN SLIM growth-stock system. O’Neil — who founded Investor’s Business Daily in 1984 — later pinned down specific time and depth requirements in his columns, which is why this base has sharper rules than most chart shapes: cups run 7 to 65 weeks (most often 3 to 6 months) and, in a normal market, retrace 12% to 33% from peak to trough.
How the cup and handle forms — and the psychology behind it
The shape is not random; it maps directly onto what buyers and sellers are doing.
- The prior uptrend. A stock or asset has been rising and reaches a high. Early buyers are sitting on gains.
- The left side of the cup. Price rolls over. Profit-takers sell, momentum fades, and the decline is at first sharp, then gradual — the rounding matters. A sharp V-bottom means panic; a rounded U means selling pressure is being absorbed slowly and calmly. That gentle curve is the tell that the decline is controlled, not a crash.
- The right side of the cup. Buyers step back in near the lows (a classic zone of supply and demand) and lift price back toward the old high. As price approaches that high, traders who bought at the top and were “trapped” underwater finally see a chance to exit at breakeven — creating overhead supply.
- The handle. That trapped-trader selling, plus fresh profit-taking, causes a small dip just below resistance: the handle. This is the pattern shaking out weak, impatient holders. Volume typically dries up here, which is a good sign — it means few sellers are left.
- The breakout. With the last weak hands flushed and supply exhausted, a relatively small burst of buying is enough to push price through resistance. The uptrend resumes.
Understanding this shakeout is the point. The handle exists to remove the sellers who would otherwise cap the next advance — a concept worth pairing with the discipline covered in our guide to trading psychology.
Decode This: The two shapes, in plain terms: The cup — a rounded, U-shaped drift down and back up. The roundness is the tell: selling was absorbed slowly, not dumped in a panic V. The handle — the small dip just below the old high. Counter-intuitively it is bullish — it shakes out impatient holders so the last supply is gone before the breakout.
How to identify a valid cup and handle
Most failed cup-and-handle trades come from calling a pattern “valid” when it isn’t. Use these proportions as a filter.

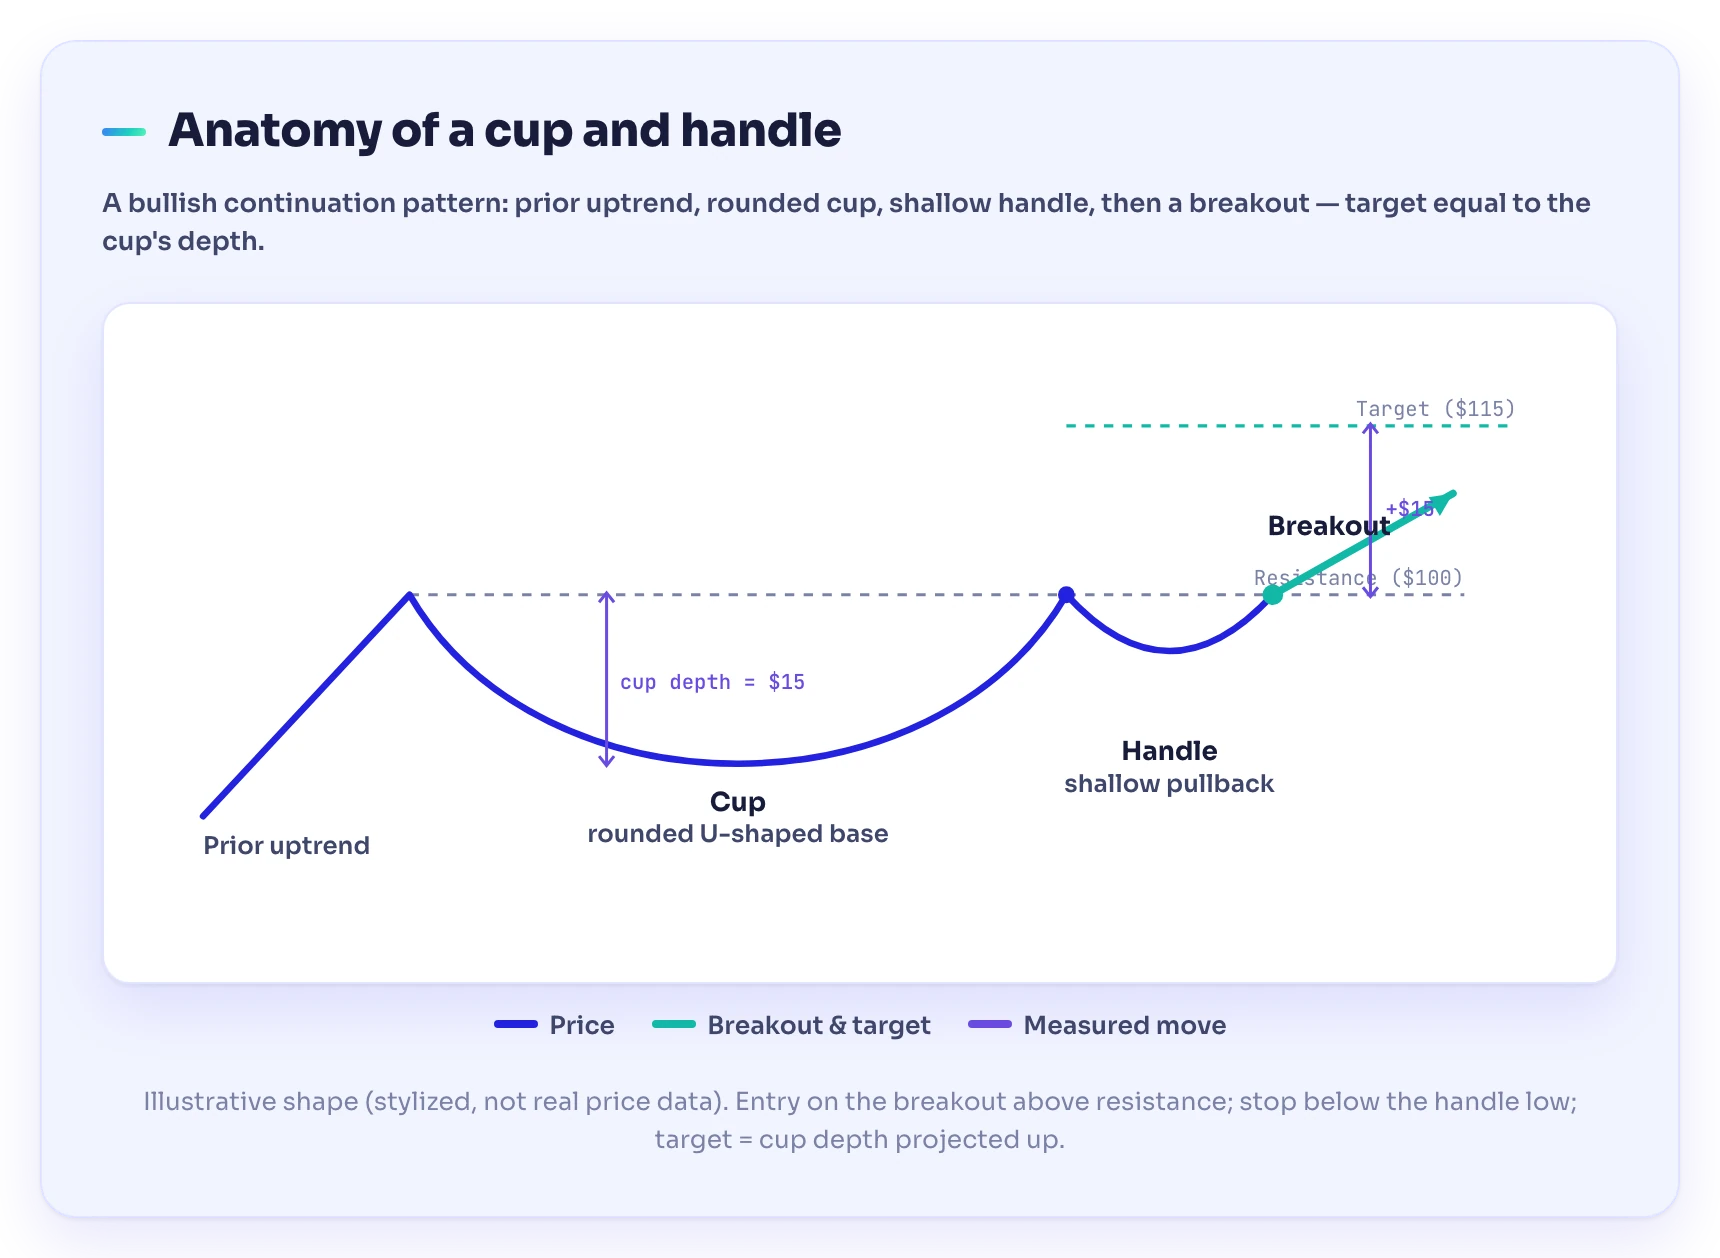
An illustrative cup and handle: a prior uptrend, a rounded U-shaped cup, a shallow handle drifting down from resistance, then a breakout with a target equal to the cup’s depth. Stylized shape for teaching — not real price data.
The cup:
- Rounded, not V-shaped. A smooth U shows orderly accumulation. A sharp V is a weaker, less reliable base.
- A prior uptrend must exist. No prior advance, no continuation to continue — that’s the single most common disqualifier.
- Depth. O’Neil’s guidance is that the cup should generally retrace 12% to 33% of the prior advance — no more than about one-third, and rarely beyond 50% even in a rough market. A cup that gives back most of the run is really a downtrend, not a base.
- Duration. On a daily chart, cups typically span 7 to 65 weeks — most commonly 3 to 6 months. Deeper, longer bases carry more weight than a two-day dip.
The handle:
- Forms in the upper half of the cup. A handle that sags into the lower half of the cup signals real weakness and often fails.
- Shallow and short. Expect a modest drift of roughly 10% to 15% off the handle’s high (O’Neil caps it near 8% to 12% for the tightest bases), formed over one to four weeks — not a second cup. If it retraces a large chunk of the cup, the buyers aren’t in control.
- Slight downward or sideways slope on declining volume. Falling volume in the handle is the confirmation that selling is drying up.
Volume — the underrated signal:
- Volume should contract through the base, often running 20% to 40% below average in the handle.
- Volume should expand sharply on the breakout — O’Neil wants at least 40% to 50% above the 50-day average, and a genuine breakout often prints 100%+. A breakout on weak volume is the classic trap; without buyers behind it, price frequently falls back below resistance.
How to trade the cup and handle pattern
Once you have a valid pattern, the trade has three mechanical parts: entry, stop, and target.

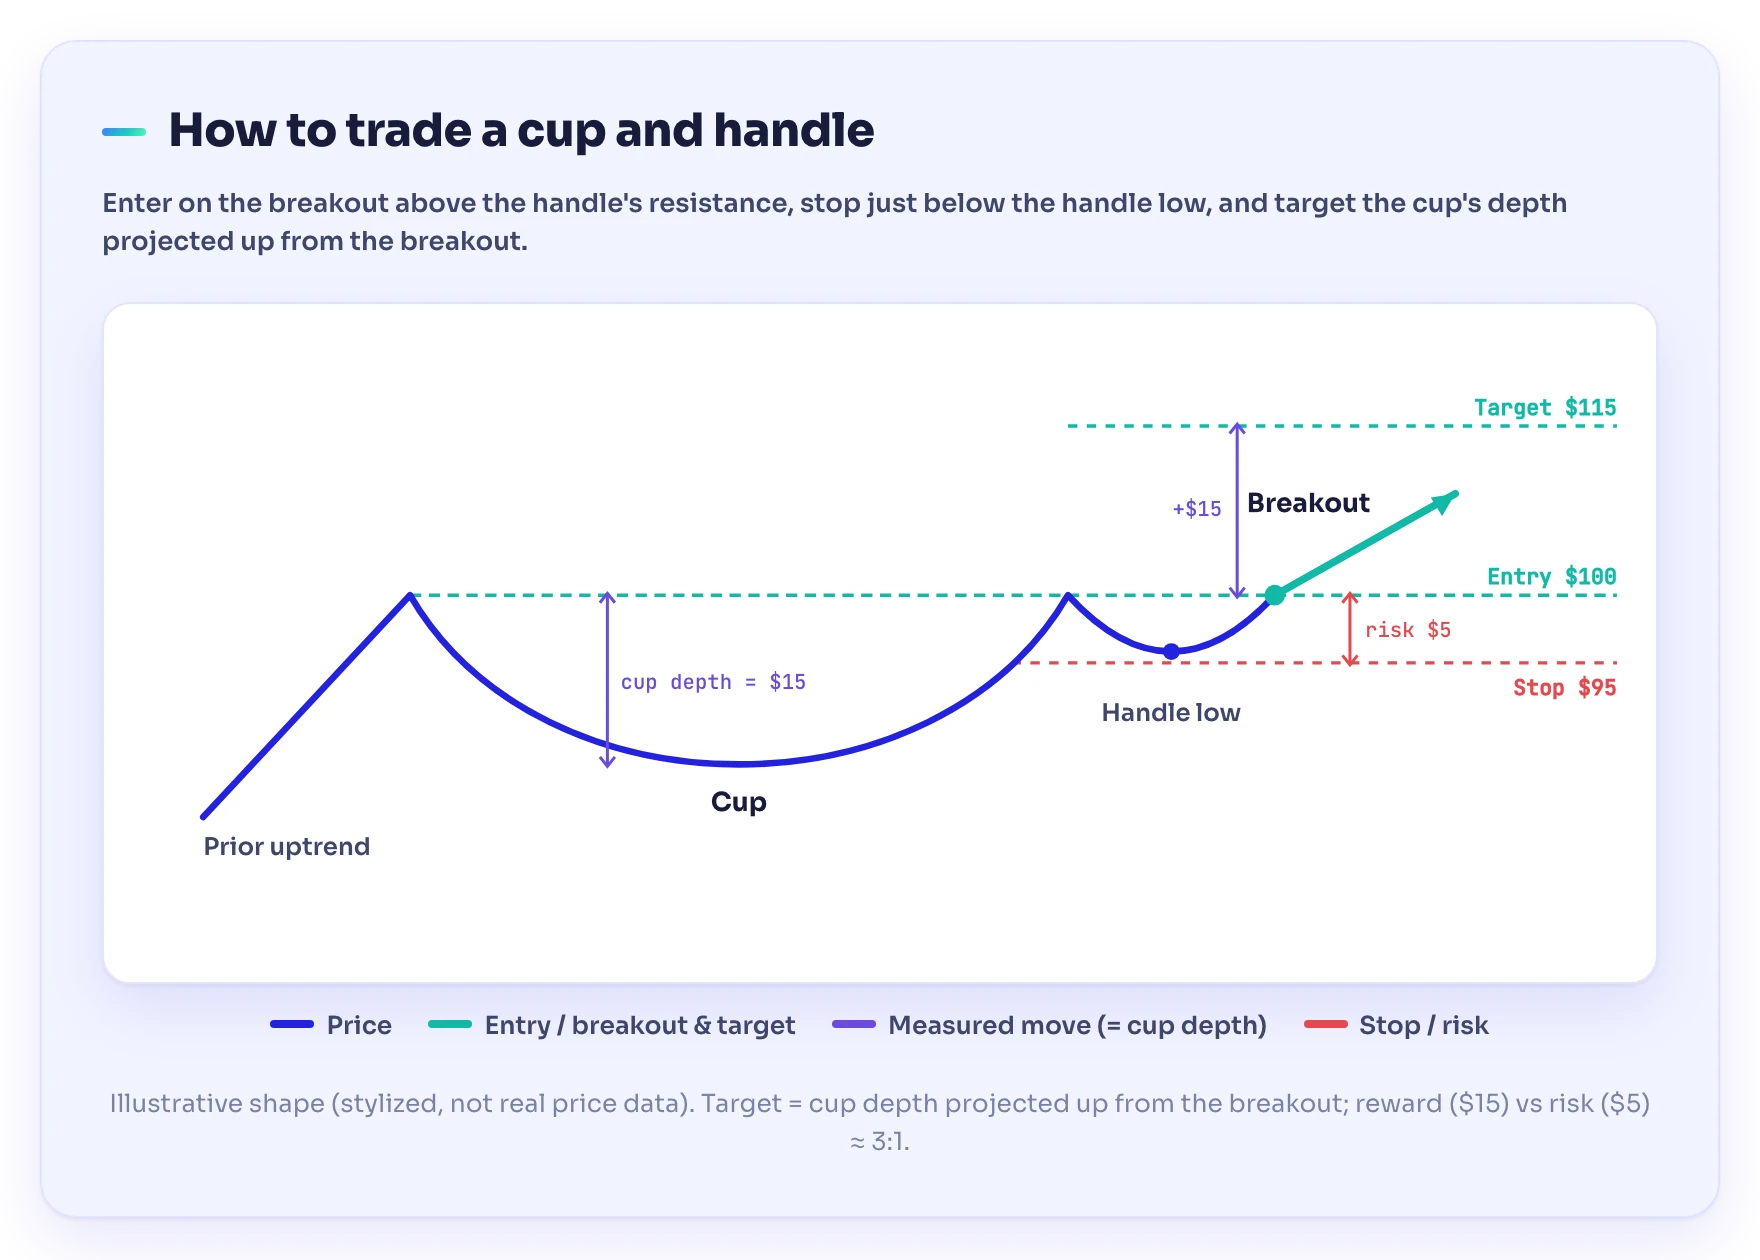
The three mechanical levels of the trade: enter on the breakout above the handle’s resistance, place the stop just below the handle low, and target the cup’s depth projected up from the breakout. Illustrative shape — not real price data.
1. Entry — the breakout. The trigger is a close above the resistance line across the top of the cup (the prior high), ideally on a clear jump in volume. Two styles:
- Breakout entry: buy as price closes above resistance. Simplest, but occasionally catches a false breakout.
- Retest entry: wait for price to break out, then pull back to the old resistance level (now acting as support) and hold. Lower risk, but you sometimes miss the move entirely.
2. Stop-loss. Place the stop below the handle’s low. If price drops back under the handle, the shakeout logic has failed and the setup is void — there’s no reason to stay in. This keeps the risk small and defined.
3. Target — the measured move. The standard cup-and-handle target is the depth of the cup, projected upward from the breakout point. Measure from the cup’s high (resistance) down to the cup’s low; add that distance to the breakout price.
Worked Example: Suppose a stock ran up to a high of $100, then over 10 weeks rounded down to a cup low of $85 — a cup depth of $15, a 15% retrace that sits comfortably inside O’Neil’s 12–33% band. It recovers to $100, then over two weeks forms a handle drifting to $95 (a 5% dip) on volume 30% below average, before breaking out above $100 on volume 60% above the 50-day norm. (Illustrative — hypothetical prices, not real data.) Entry: ~$100 on the breakout. Stop: just below the $95 handle low — about $5, or 5%, of risk per share. Target: $100 + $15 (cup depth) = $115, a $15 (15%) potential gain. That’s roughly $15 of reward against $5 of risk — a 3:1 ratio if the pattern plays out. It often won’t, which is why the stop is non-negotiable.
The inverted cup and handle (the bearish version)
The inverted cup and handle is the mirror image — a bearish continuation pattern that appears within a downtrend.
- The cup is an upside-down U (a rounded top, or arch) instead of a bowl.
- The handle is a small upward drift on the right side instead of a downward one.
- The signal is a breakdown below the neckline/support at the bottom of the arch, not a breakout above resistance.
- The target is the same idea flipped: project the cup’s depth downward from the breakdown point, with a stop just above the handle’s high.
Traders use the inverted version to time short entries or to exit longs, particularly in falling markets. The volume logic is identical: you want volume expanding on the breakdown.
Common mistakes and why the pattern fails
No pattern is a guarantee, and this setup fails often. The usual culprits:
- Trading a V-shaped “cup.” Sharp, panicky bottoms are less reliable than rounded ones. Be patient for the curve.
- A too-deep cup or handle. A cup that retraces most of the prior trend, or a handle that sinks into the lower half of the cup, signals sellers are still in charge.
- Ignoring volume. A breakout on weak volume is the single biggest tell of a false move. No volume, no trade.
- No prior uptrend. A “cup and handle” with nothing before it has no trend to continue. It’s just a squiggle.
- Jumping in early. Buying inside the handle before the breakout confirms means guessing. Wait for the close above resistance.
- No stop-loss. The pattern’s whole edge depends on cutting the trade when the handle low breaks. Without a stop, one failed pattern can erase several winners.
For a side-by-side of this and the other formations, keep our chart patterns cheat sheet open while you chart.
Does the cup and handle work in forex and crypto?
Yes — the pattern is market-agnostic. It was defined for stocks, but because it reflects universal crowd behavior (accumulation, a shakeout, then a breakout), it appears on any liquid, chart-able market:
- Stocks — its original home; works well on daily and weekly charts of trending NYSE and Nasdaq equities, exactly where O’Neil hunted for it.
- Forex — appears across major and minor pairs like EUR/USD and GBP/JPY; traders often watch the 4-hour and daily timeframes.
- Crypto — common on Bitcoin, Ethereum, and larger altcoins, though crypto’s higher volatility (often 3 to 5 times a blue-chip stock’s) produces messier handles and more false breakouts, so volume confirmation and a tight stop matter even more.
The rules don’t change by asset — only the volatility does. On faster, noisier markets, demand cleaner proportions and stronger breakout volume before you act.
Frequently asked questions
Is the cup and handle a bullish or bearish pattern?
The standard cup and handle is bullish — a continuation pattern that suggests an existing uptrend will resume after the breakout. The inverted cup and handle is its bearish counterpart, signaling a likely continuation lower.
How reliable is the cup and handle pattern?
It’s a well-known, widely-watched setup, but no chart pattern is a sure thing. Reliability improves when the cup is rounded, the handle is shallow and in the upper half, volume contracts through the base and expands on the breakout, and you trade with a stop-loss. Many textbook-looking patterns still fail.
How do you set a price target on a cup and handle?
Measure the depth of the cup — from the resistance line at the top down to the lowest point — and project that same distance upward from the breakout point. If the cup is $15 deep and the breakout is at $100, the target is about $115.
Where do you put the stop-loss?
Just below the low of the handle. If price falls back under the handle, the pattern has failed and the trade should be closed.
How long does a cup and handle take to form?
On a daily chart, the cup typically develops over several weeks to a few months, with the handle forming over days to a few weeks. Shorter patterns appear on lower timeframes but tend to be noisier and less reliable.
What is an inverted cup and handle?
A bearish mirror image: a rounded-top “arch” (the inverted cup) followed by a small upward-drifting handle, completed by a breakdown below support. The target projects the cup’s depth downward.
Keep leveling up
This base is one pattern in a much larger playbook. The fastest way to internalize it is to mark up live charts, spot the shape forming, and paper-trade the breakout before risking real money.
Paper-Trade It First: Learning alongside a trading community or academy like TradeGATEHub — where you can compare setups and pressure-test your reads against other traders — tends to beat studying in isolation. Start with the full chart patterns cheat sheet, then explore the rest of the TradeGATEHub Academy.
Sources
- O’Neil, W. J. (1988). How to Make Money in Stocks: A Winning System in Good Times and Bad. McGraw-Hill — the book in which the cup-and-handle base and CAN SLIM system were first defined. McGraw-Hill / worldcat.org
- Investopedia. Master the Cup and Handle Pattern: Trading Strategies and Targets — corroborates O’Neil’s authorship, the four stages, the ≤50% retracement depth guideline, and the measured-move target. investopedia.com
Risk warning. Trading stocks, forex, and CFDs carries a high level of risk and may not be suitable for all investors. Chart patterns, including the cup and handle, are educational tools, not trading signals, and do not guarantee results. Past performance and illustrative examples do not predict future outcomes. This article is for educational purposes only and does not constitute financial advice.