



The double bottom pattern in crypto is a W-shaped bullish reversal. Price falls to a low, bounces, sells off to roughly the same low, then rallies. It shows that sellers tested one support level twice and failed. The signal only counts once price closes above the “neckline” — the peak between the two lows — on rising volume. Not before.
That confirmation rule is the whole game, and crypto makes it harder than any market. This page is the crypto-specific version of a classic reversal. For the mechanics across all markets — including its mirror, the double top — start with our full double top and double bottom guide. Here the chart is Bitcoin or Ethereum: 24/7 price action, brutal capitulation wicks, and fakeouts that trap early buyers.
What a double bottom looks like on a crypto chart
A double bottom forms after a clear downtrend, once selling momentum fades. It has three parts:
- First trough — price drops to a low as selling peaks, then buyers step in and bounce it.
- Reaction peak (the neckline) — the bounce stalls at resistance. That high becomes the neckline you watch for the breakout.
- Second trough — price falls again toward the first low but holds near the same level. Sellers can no longer force a new low.
Together, the two lows and the middle peak trace the letter W — in crypto, a “W bottom.” It appears on a 15-minute BTC scalp chart and a weekly ETH chart alike, but the two carry very different weight: a weekly-close W marks a multi-month trend turn, while a 15-minute one may last hours. The higher the timeframe, the more the pattern carries.
What “the neckline” means: The neckline is the horizontal resistance line drawn across the reaction peak — the highest point between the two troughs. It is the single level that matters: price closing above it is what turns “two dips that look similar” into a confirmed double bottom. Below the neckline, you have a potential pattern, nothing more.
The anatomy of a double bottom in crypto

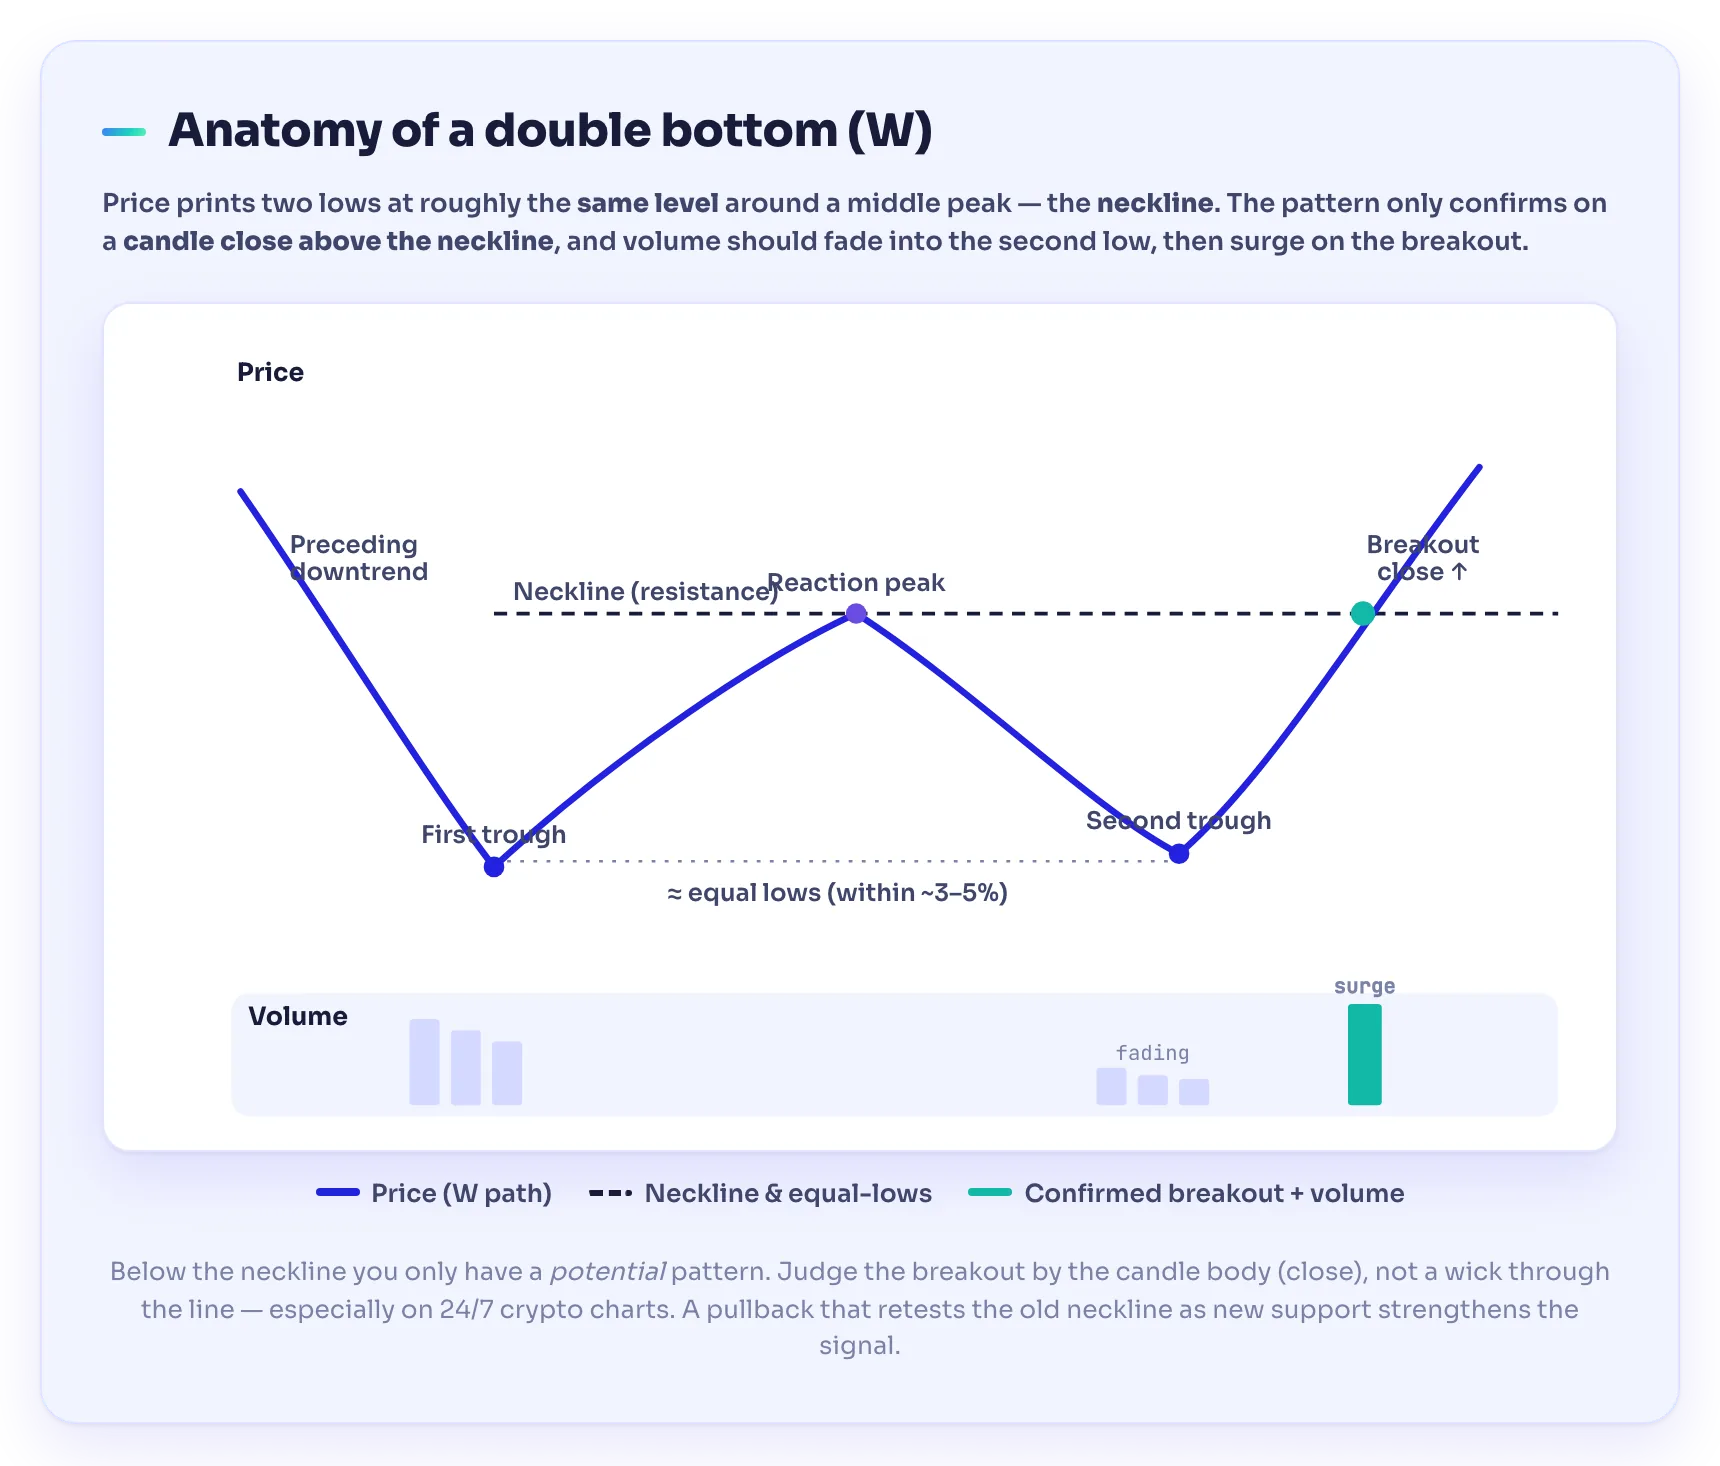
Not every double dip is valid. Traders check these structural conditions before trusting a W:
| Element | What to look for | Why it matters in crypto |
|---|---|---|
| Preceding downtrend | A clear decline into the first low, not a sideways range | Crypto chops sideways for weeks — a W inside a range is noise, not a reversal |
| Two similar lows | Second trough within roughly 3–5% of the first | A meaningfully lower second low means the downtrend is still intact |
| Spacing between lows | Days to weeks apart; often 2–6 weeks on a daily chart | 24/7 markets print micro-Ws constantly; wider spacing filters the junk |
| Fading volume into the second low | Lighter selling on the second drop | Shows capitulation is exhausting, not accelerating |
| Neckline breakout on rising volume | A close above the neckline, volume above average | The only real confirmation — see the next section |
The psychology holds on any asset. The first low is where panic selling exhausts itself. The bounce is the first buyers returning. The second low re-tests the fear — and when it holds within roughly 3-5% of the first, the sellers who drove the drop have run out of coins.
Confirming the pattern: the neckline break and volume
One rule separates traders who profit from the double bottom from those it burns: the pattern is not complete until price closes above the neckline. Two equal lows on their own are just two lows.
According to StockCharts ChartSchool, volume matters more for a double bottom than for its bearish twin, the double top. Buying pressure should visibly accelerate on the rally off the second trough and on the breakout itself. A neckline break on thin, drifting volume is the classic trap.
Three checks turn a breakout into a confirmed signal:
- A close above the neckline — not an intraday spike. A wick that pokes above and closes back below confirms nothing.
- Rising volume on the breakout — the breakout candle should beat recent average volume (many traders want it well above the prior 20-candle average). Watch real spot volume, not one exchange’s wash-traded print.
- A successful retest — price often pulls back to the neckline first. Old resistance holding as new support beats the breakout candle alone.
Watch for Traps: A double bottom is a probability, not a promise — and the honest data is sobering. Studying decades of US stock data, chart-pattern researcher Thomas Bulkowski found that only about 52% of two-bottom formations actually confirmed (closed above the neckline); the other 48% broke below the second low instead, handing early buyers a loss. Waiting for the confirmed neckline close roughly halved the failure rate and doubled the median gain. Crypto’s volatility does not improve those odds — it makes jumping the gun even more expensive. No pattern predicts the future; it only tilts the odds when you wait for confirmation.
Why crypto wicks cause false confirmations
This is the section stock textbooks skip. Crypto trades 24/7 with no closing bell, thin weekend liquidity, and leverage-driven liquidation cascades where up to 100x positions unwind in seconds. The result is long wicks — candles with huge shadows where price spiked far past where it settled, sometimes 5-10% below the body on a single capitulation candle.
Long wicks wreck the double bottom two ways:
- They fake the breakout. A liquidation squeeze or stop-hunt can push price above the neckline for minutes, trip breakout orders, then snap straight back down. On a 5-minute chart that looks confirmed; on the close it never was.
- They distort the lows. A capitulation wick can print several percent below real support, making two equal troughs look unequal when the bodies lined up.
The defenses cost nothing but patience:
- Judge by candle bodies (closes), not wicks. A neckline breaks on a close above it, never a shadow through it.
- Use a higher timeframe. A 4-hour or daily close above the neckline is far harder to fake than a 5-minute one.
- Confirm with a second tool. The RSI turning up, or bullish divergence into the second low, adds confluence. Two independent signals beat one shape.
Setting a measured-move target

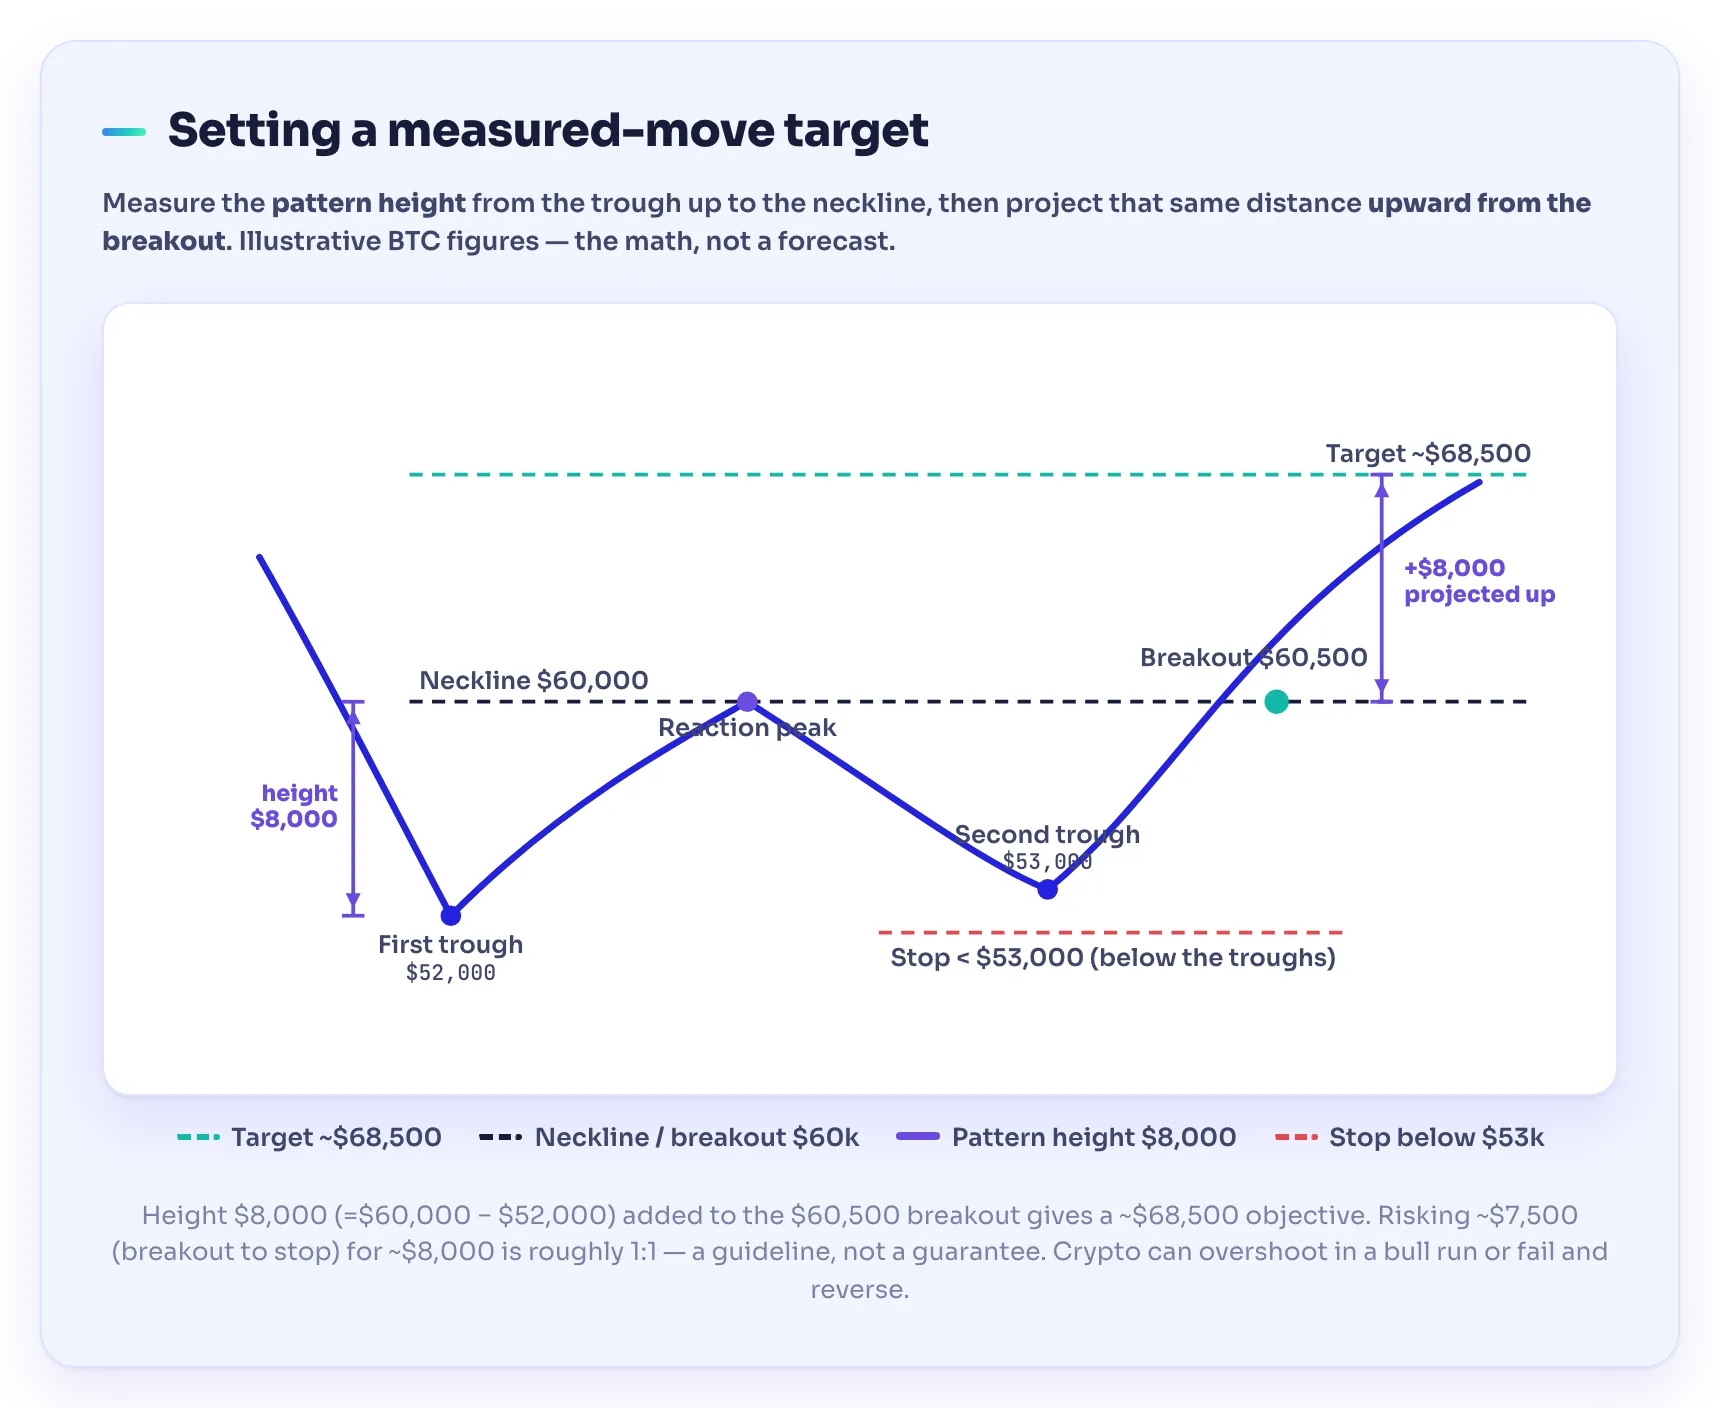
The double bottom carries a built-in profit objective, the measured move: take the pattern height (trough up to neckline) and project it upward from the breakout point.
Worked Example: All figures below are illustrative only — a made-up BTC setup to show the math, not a forecast.
- First trough: $52,000
- Neckline (reaction peak): $60,000
- Second trough: $53,000 (within ~2% of the first — valid)
- Breakout close: $60,500
Pattern height = $60,000 − $52,000 = $8,000. Measured target = $60,500 breakout + $8,000 = ~$68,500. A common stop-loss sits below the second trough (here, under $53,000): if price closes back below that low, the pattern has failed and the trade thesis is gone. This gives a defined risk and a defined objective before you enter — the point of trading a pattern at all.
Treat the measured target as a guideline, not a guarantee. Crypto can overshoot it in a bull run or fall short and reverse. In the illustrative setup above, risking ~$7,500 (breakout to stop) to target ~$8,000 gives roughly a 1:1 reward-to-risk — modest, and a reason many traders scale out rather than hold for the full projection. It sizes reward against risk; it is not a price that “must” print.
Common mistakes with the crypto double bottom
- Buying before the neckline close. The single most expensive error — nearly half of unconfirmed patterns fail. Wait for the close.
- Trading wicks as breakouts. A shadow above the neckline on a 5-minute chart is not a confirmation. Bodies and higher timeframes only.
- Ignoring volume. A neckline break on falling volume is a warning, not a green light.
- Forcing the pattern in a range. A W inside sideways chop, with no preceding downtrend, is not a reversal signal.
- Skipping the stop. Without a stop below the second trough, a failed pattern turns a small planned loss into a large unplanned one.
- Fighting your own psychology. A second test of the lows feels terrifying — that fear is exactly what traps sellers. Our notes on trading psychology pair naturally with reversal trading.
Where to go next
The double bottom is one shape in a large vocabulary. It sits beside its bearish mirror, the double top, and dozens of others in the chart patterns cheat sheet. It is most reliable when it confirms a level or a momentum read rather than acting alone — the core idea behind all technical analysis.
Level Up: Reading reversals on live 24/7 crypto charts is a skill of repetition. A community-led academy like TradeGATEHub — with free trading education and a live academy — is a low-pressure way to practice tagging real double bottoms before you risk your own capital.
Checkpoint: A double bottom is a W-shaped bullish reversal, but it only becomes tradeable on a candle close above the neckline with rising volume. In crypto, judge everything by closes, not wicks; lean on higher timeframes; confirm with a second tool; and set your stop below the second trough. It tilts the odds — it does not guarantee the outcome.
Frequently asked questions
What is a double bottom pattern in crypto?
A double bottom is a W-shaped bullish reversal pattern that forms after a downtrend, with two lows at roughly the same price separated by a bounce (the neckline). In crypto it appears on any timeframe and signals that sellers tested a support level twice and failed, hinting the trend may turn up — once price closes above the neckline.
How do you confirm a double bottom?
Confirmation comes when price closes above the neckline — the peak between the two lows — ideally on above-average volume. A pullback that retests the neckline as new support strengthens the signal. Two equal lows alone are not enough; without the neckline close, you only have a potential pattern, not a confirmed one.
Why are crypto double bottoms prone to false signals?
Crypto trades 24/7 with thin liquidity and leverage-driven liquidation cascades, which print long wicks. A wick can spike above the neckline for minutes and snap back, faking a breakout, or dip far below support and distort the lows. Judging the pattern by candle closes and higher timeframes filters most of these fakeouts.
How do you set a price target for a double bottom?
Use the measured move: subtract the trough price from the neckline price to get the pattern’s height, then add that height to the breakout point. For an illustrative BTC pattern with a $52,000 low and a $60,000 neckline, the $8,000 height projects to a ~$68,000 target. Treat it as a guideline, not a guarantee.
Is the double bottom a reliable reversal signal?
It tilts the odds but does not guarantee a reversal. Research on decades of stock data found only about half of two-bottom formations confirmed, while the rest broke lower — and waiting for the neckline close roughly halved the failure rate. Crypto’s volatility does not improve those odds, so confirmation and a stop-loss are essential.
What is the difference between a double bottom and a double top?
A double bottom is a W-shaped bullish reversal that forms after a downtrend, with two lows and a breakout above the neckline. A double top is its M-shaped bearish mirror image, forming after an uptrend with two peaks and a breakdown below the neckline. Both use the same neckline-and-volume confirmation logic in opposite directions.
Sources
- StockCharts ChartSchool — Double Bottom Reversal — reference for the pattern’s structure (two roughly equal troughs, a moderate peak, and a confirming resistance break), and the note that volume is more important for the double bottom than the double top, with buying pressure needing to accelerate on the advance off the second trough. chartschool.stockcharts.com
- Bulkowski, Thomas N. — The Best Entry (double / twin bottoms), thepatternsite.com — statistical study of bull-market data (502 stocks, 1990–2018) finding that ~52% of twin-bottom formations confirmed while ~48% closed below the second bottom before confirming, and that waiting for the confirmed neckline close cut the 5% failure rate roughly in half and doubled the median rise. Used for the honest “wait for confirmation” caveat. thepatternsite.com
Risk warning. Trading and CFDs carry a high level of risk and may not be suitable for all investors. Chart patterns like the double bottom are educational tools, not trading signals, and do not guarantee results — a large share of patterns fail, and breakouts can reverse. Cryptoassets are highly volatile and largely unregulated. This article is for educational purposes only and does not constitute financial advice.