



The double top pattern in commodities is a bearish reversal. It forms when a market like gold, crude oil, or natural gas rallies to a resistance level twice, fails both times at roughly the same price, and then breaks the support “neckline” between the two peaks. Two failures at one ceiling signal exhausted buyers — a possible trend change, not a guaranteed one. In Thomas Bulkowski’s data, confirmed double tops decline about 15% on average but break even (fail to fall a useful amount) 25% of the time.
For the mechanics of the shape itself, start with the full guide to the double top and double bottom pattern. This article covers the commodities-specific version: why raw-materials markets print double tops at supply-driven resistance, how seasonality and supply shocks bend the textbook shape, how to confirm the break on a continuous futures chart, and how to measure the target honestly.
The anatomy of a double top on a commodity chart

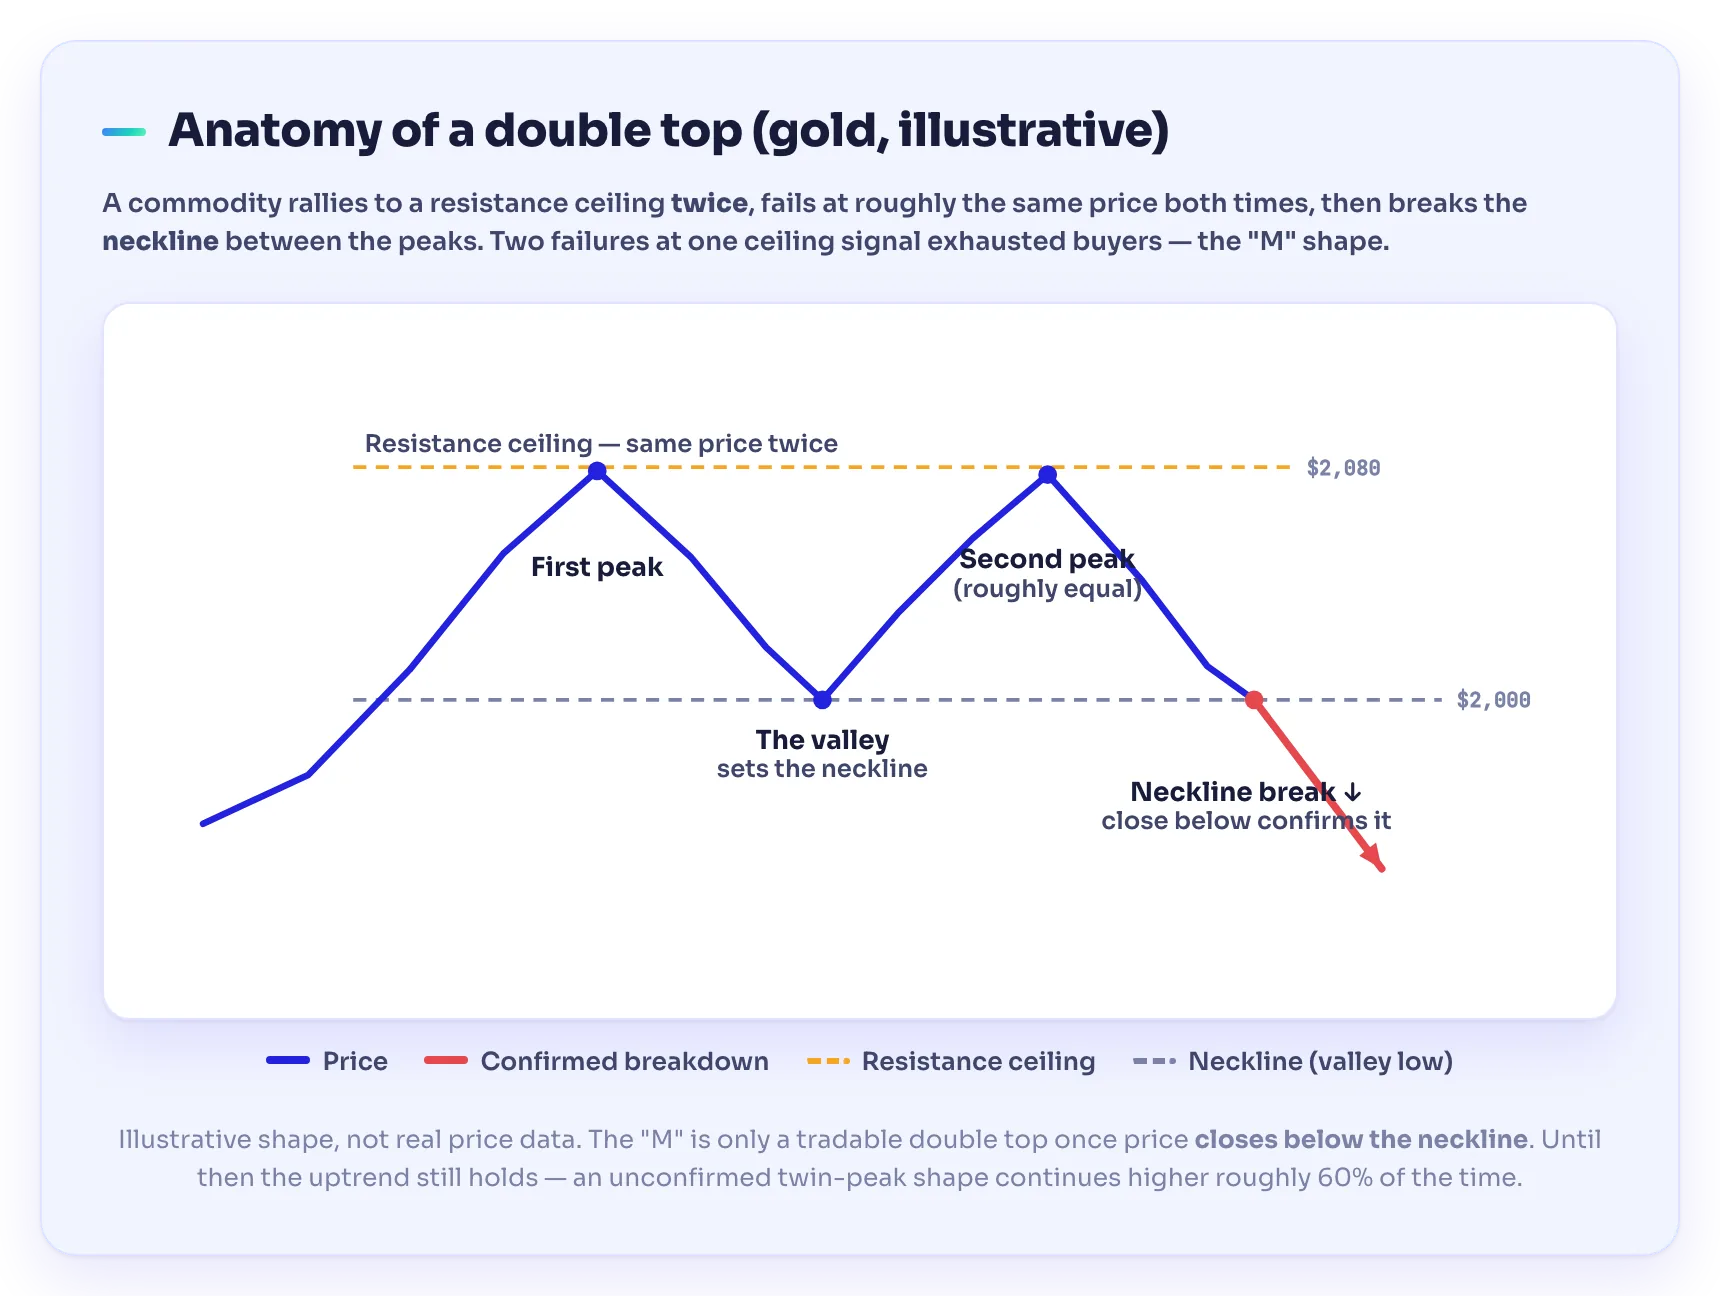
A double top has three parts, and the order matters:
- The first peak. Price rallies into a resistance zone — a prior high, a round number ($2,000 gold, $100 crude), or a known supply level — and turns down.
- The valley (the neckline). Price pulls back to support. The low of this pullback sets the neckline, the line that must break to confirm the pattern.
- The second peak. Price rallies again toward the same resistance, makes a roughly equal high, and fails again. Two failures at one ceiling mean demand cannot clear that price.
The shape looks like the letter “M.” But an “M” on the screen is not yet a pattern. The double top becomes a tradable signal only when price closes below the neckline. Until then, the uptrend is still in force.
Decode This — the neckline: The neckline is the horizontal support drawn across the lowest point of the valley between the two peaks. It is the trigger line: a decisive close below it confirms the double top and marks the start of the potential reversal. Above it, you still have an uptrend with a stubborn ceiling — not a reversal.
Why commodities print clean double tops
The double top is a universal shape. Commodities give it a distinctive character because their resistance levels track real-world supply and demand, not just chart memory.
- Supply ceilings are physical. In crude oil, a price high enough to choke demand or restart shut-in shale production sets a real economic ceiling. Buyers fail there because the fundamentals push back, printing the two matched peaks a double top needs.
- Round numbers concentrate orders. Commodities trade in widely-watched whole numbers, so stop and limit orders cluster at levels like $2,000 gold or $100 crude. A market can tag the same figure twice and reverse.
- News drives the retest. A second run at the highs often rides a supply scare — an OPEC+ output headline, a Gulf hurricane, a cold-snap forecast. When that catalyst fades without a new high, the failed second peak is your double top.
Seasonality reinforces all three. A seasonal high that gets retested weeks later and fails often prints as a double top near the same price:
| Commodity | Watched round levels | Seasonal high tends to form |
|---|---|---|
| Gold | $2,000, $100 steps | Macro- and rate-driven, weak seasonality |
| WTI crude oil | $80, $100 | Into the summer driving season |
| Natural gas | $3 | Into winter heating demand |
This is the supply and demand logic behind the shape: the pattern is the visible fingerprint of buyers exhausting themselves at a price the market cannot sustain.
Worked Example — a double top in gold (illustrative): Numbers below are illustrative, to show the method — not a forecast or a real trade.
Say gold futures rally to $2,080, pull back to a valley at $2,000, then rally again and stall at $2,078 — a second peak at the same ceiling. The pattern height is the distance from the peaks to the neckline: $2,080 − $2,000 = $80.
The pattern is not confirmed while price holds above $2,000. Only when gold closes decisively below the $2,000 neckline does the double top trigger. See the next section for how that $80 height becomes a target.
Confirming the reversal on the continuous contract
Most commodity charts are continuous contracts — a stitched series that rolls from the expiring front-month future into the next. This creates a wrinkle the stock trader never faces.
When a contract in contango (later months priced higher) rolls, the continuous chart can gap at the roll date. That artificial gap can fake a “neckline break” or hide a real one. Two habits fix this:
- Confirm the break on a close, not a wick. Commodities wick hard through levels intraday. StockCharts ChartSchool advises waiting for a convincing break — many traders use a filter such as a close 3% beyond the neckline, or a hold of two to three days.
- Cross-check the front-month contract at the break. In the illustrative gold case, verify the close below $2,000 on the active contract so a roll gap does not fake a broken support that only rolled.
The rule from the classic literature is blunt: do not anticipate the break. Bulkowski’s data shows that entering on twin peaks before the neckline gives way carries a roughly 60% chance price continues higher, with no confirmed pattern at all — the shape only counts once price closes below the valley low.
Watch for Traps — the pattern is probabilistic, not predictive: A confirmed double top is a lean, not a promise. In Thomas Bulkowski’s statistical study, confirmed double tops still fail to fall a meaningful amount about 25% of the time, and only around 64% ever reach their full measured-move target. Commodities add their own traps: a supply shock can blow price straight back through the second peak, turning a “textbook” double top into a false top and a losing short. Never treat the shape as a guarantee — size positions and place stops as if it can fail, because a quarter of the time it does.
How to measure the target

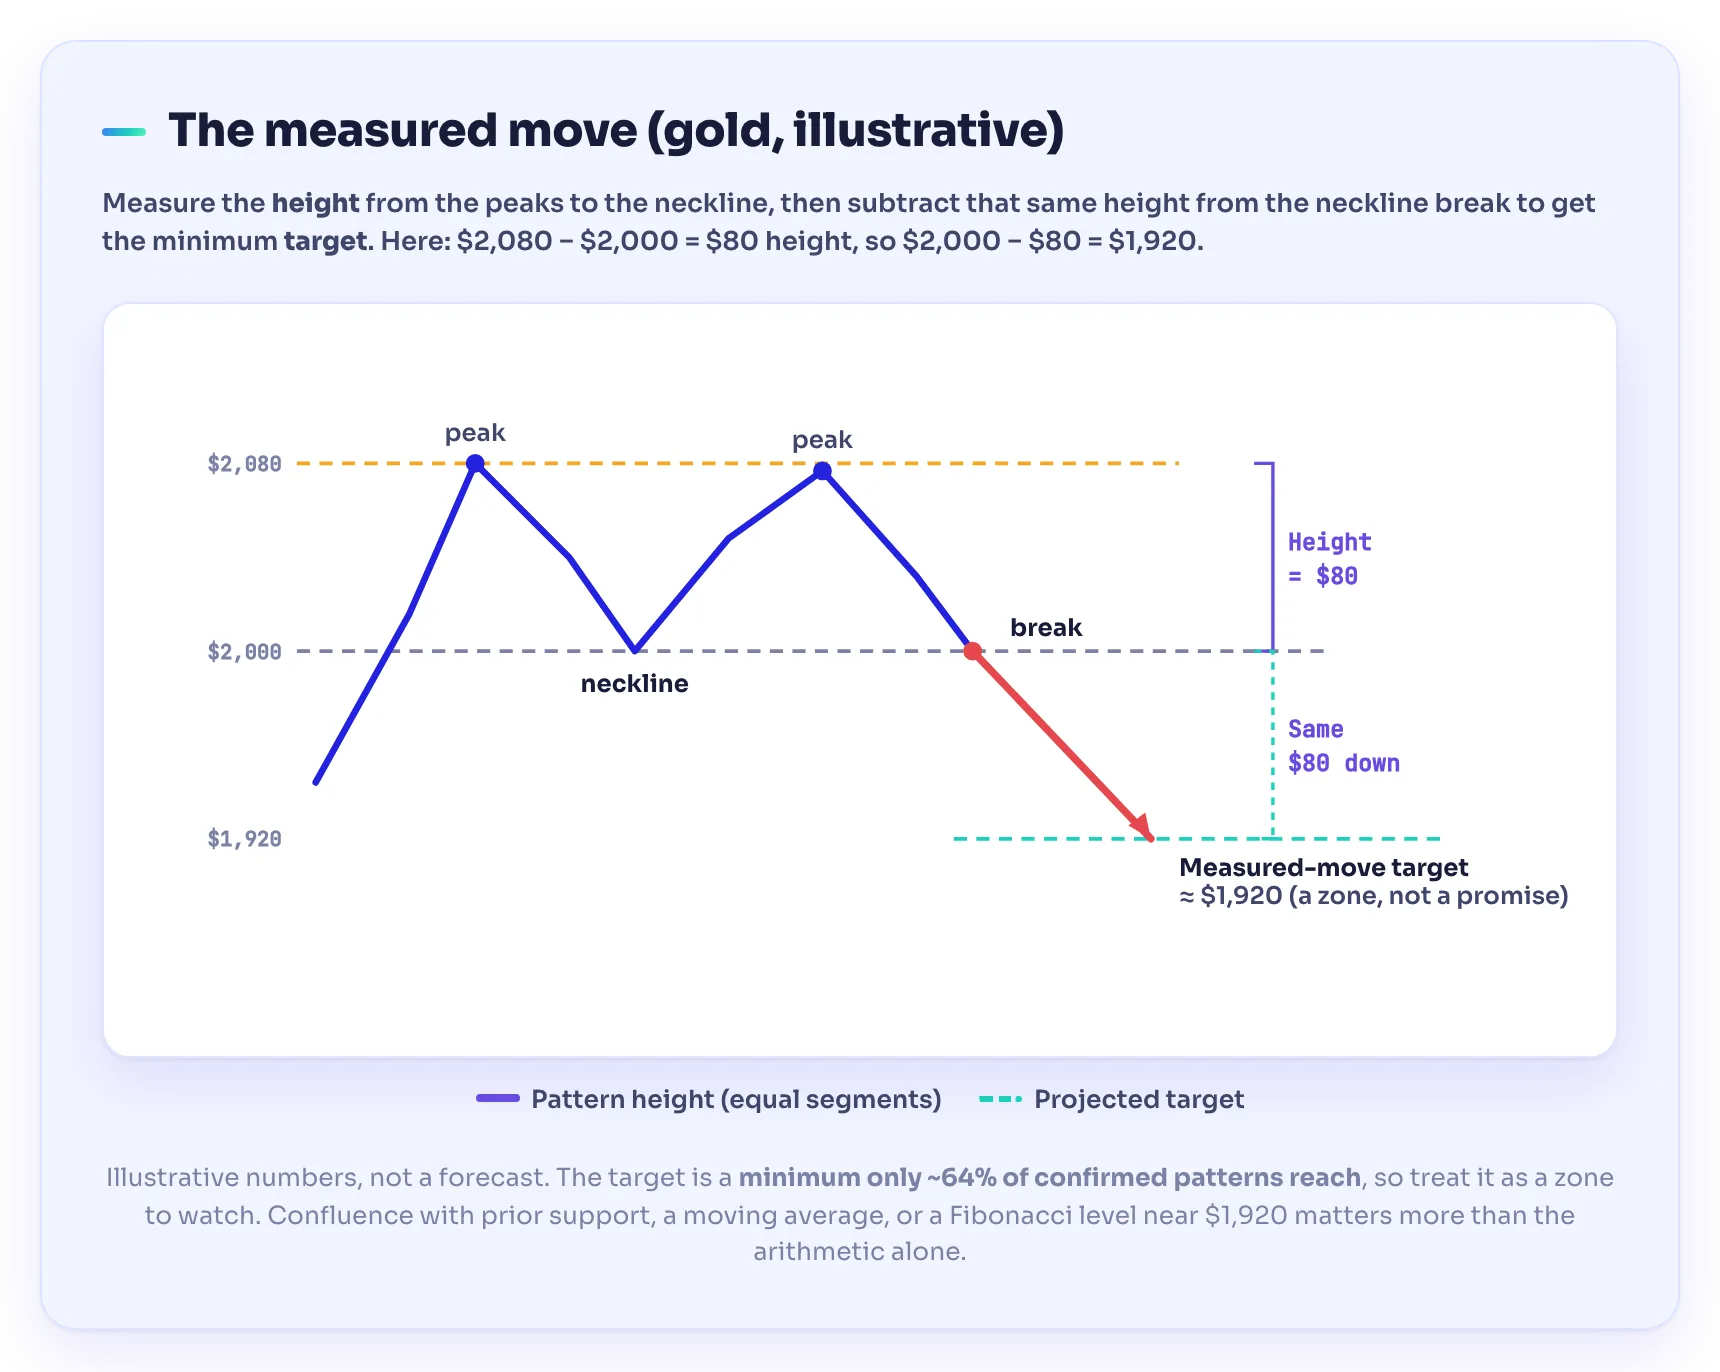
The classic measure rule is simple and the same across every market:
- Measure the height of the pattern — the vertical distance from the peaks down to the neckline.
- Subtract that height from the neckline break point.
- The result is the minimum measured-move target.
Take the illustrative gold example above: height $80, neckline $2,000, so the projected target is $2,000 − $80 = $1,920. StockCharts ChartSchool frames it the same way — the larger the formation, the larger the potential decline. Tall patterns imply deeper targets.
Two caveats specific to commodities:
- The target is a minimum that only ~64% of patterns reach, and Bulkowski’s confirmed double tops average a ~15% decline. Treat the number as a zone to watch, not a price the market owes you.
- Look for confluence. If a prior support shelf, a moving average, or a Fibonacci level sits near your $1,920 target, that zone matters far more than the arithmetic alone.
Volume, and spotting the false top
Volume is the health check that separates a real reversal from a trap. Commodity futures let you read it cleanly.
- The break should come on rising volume. A neckline break on expanding volume shows real selling conviction. A break on thin, holiday, or overnight volume is suspect and more likely to reverse.
- Watch the second peak’s momentum. A weaker rally to the second peak — smaller range, fading volume — strengthens the reversal case. A fresh volume surge into that peak means buyers are not done, so the “top” may not hold.
- Beware the supply-shock re-break. In natural gas and crude, a fresh weather forecast or inventory surprise can push price back above the peaks days after a “confirmed” break. That failed break is a classic false top. So a stop just above the second peak, and a plan for being wrong, is not optional.
Checkpoint — the four-step read:
- Two roughly equal peaks at a supply/resistance ceiling, ideally weeks apart.
- A neckline at the valley low between them.
- A decisive close below the neckline, on rising volume, confirmed on the front-month contract — this is the trigger.
- A measured-move target (pattern height projected down from the break), used as a zone, with a stop above the second peak.
Miss step 3 and you do not have a double top yet — you have an uptrend with a ceiling.
Common mistakes commodity traders make
- Trading the shape before the break. The most expensive error: an unconfirmed “M” resolves higher about 60% of the time. Wait for the neckline close.
- Ignoring the roll gap. A continuous-contract gap can fake a break. Confirm on the front month.
- Fighting a supply catalyst. Shorting into a live weather or OPEC story fights the fundamentals that set the resistance. Let the chart confirm first.
- No stop, or a stop too far. Place the stop just above the second peak. If price reclaims that peak, the reversal thesis is dead. Accept it.
- Forcing the pattern. Peaks that are wildly unequal, or only a day or two apart, are ordinary resistance, not a reversal. If you have to squint, it is not a clean double top. The trading psychology trap is wanting the top to be real.
Where to go next
The double top is one shape in a wider skill: reading reversals in context. It pairs with the mirror-image double bottom (covered in the pillar guide), sits inside the discipline of technical analysis, and works best when it lines up with a level from the chart patterns cheat sheet rather than standing alone.
Level Up: If you are building your chart-reading skills from scratch, a structured, community-led academy like TradeGATEHub — with free trading education and a live academy — is a low-pressure way to practice spotting double tops on live commodity charts before you risk real money.
Pattern reading is a skill of repetition. The more clean double tops you tag and track — including the ones that fail — the faster the real odds start to read themselves.
Frequently asked questions
What is a double top pattern in commodities?
A double top is a bearish reversal pattern where a commodity such as gold or oil rallies to a resistance level twice, fails both times at roughly the same price, and then breaks the support neckline between the two peaks. It suggests buyers are exhausted at that ceiling and a downtrend may begin — a probability, not a certainty.
How do you confirm a double top?
Wait for price to close decisively below the neckline — the low of the valley between the two peaks — ideally on rising volume. Before that close, the uptrend is still intact. Jumping in early is risky: roughly 60% of twin-peak shapes continue higher without ever confirming the pattern.
How do you measure the price target of a double top?
Measure the height from the peaks down to the neckline, then subtract that height from the neckline break point. That is the minimum measured-move target. It is only an estimate, though — historical data shows only about 64% of confirmed double tops actually reach their full target.
Why are double tops common in gold and oil?
Commodities have physical, supply-driven resistance ceilings and strong seasonality, so price often tags the same level twice — for example a winter high in natural gas or a round number like $2,000 in gold. When a supply-scare rally fails to make a new high, it frequently prints as a double top.
What is a false double top?
A false double top is one that appears to confirm — price breaks the neckline — but then reverses back above the peaks, trapping short sellers. In commodities this often follows a fresh supply shock (a weather event, an OPEC headline, an inventory surprise). A stop just above the second peak limits the damage when this happens.
Is a double top pattern reliable?
It is a useful edge, not a guarantee. In Bulkowski’s statistical work, confirmed double tops still fail to decline meaningfully about 25% of the time. Treat the pattern as one probabilistic signal, confirm it with a neckline close and volume, use a stop, and combine it with support/resistance and trend context.
Sources
- StockCharts ChartSchool — Double Top Reversal — reference for the pattern’s definition, the support/neckline-break confirmation (“the trend is in force until proven otherwise”), the measure rule (“subtract the distance from support break to peak to obtain a price target”), the role of volume, and the guidance to wait for a convincing break rather than anticipating it. chartschool.stockcharts.com
- Bulkowski, Thomas N. — Adam & Adam Double Tops, thepatternsite.com — statistical study of the pattern: a 25% break-even failure rate and ~15% average decline for confirmed patterns, only ~64% reaching the measured-move target, and the finding that unconfirmed twin peaks continue higher without confirming roughly 60% of the time. thepatternsite.com/aadt.html
Risk warning. Trading and CFDs carry a high level of risk and may not be suitable for all investors. Chart patterns like the double top are educational tools, not trading signals, and do not guarantee results — confirmed patterns still fail a meaningful share of the time, and commodity supply shocks can reverse them quickly. This article is for educational purposes only and does not constitute financial advice.