



A fair value gap (FVG) is a three-candle price imbalance: the middle candle moves so fast that the first candle’s wick and the third candle’s wick never overlap, leaving a gap between them. Traders read this void as unfinished business — a price area the market often revisits before continuing.
If you have ever seen price rocket through a level and then drift back to the exact spot it left behind, a fair value gap is one lens that explains it. Below we cover what an FVG is, bullish vs. bearish, how to spot one, why price so often returns to “fill” the gap (and why that is a probability, not a promise), and how to build entries, stops, and targets around them.
The idea behind an FVG: markets move on imbalance
Every candle on a chart is a record of buyers and sellers meeting. Price barely moves when the two sides are balanced. It travels fast — in big, one-sided candles — when they are not. A fair value gap is simply the fingerprint that a fast, one-sided move leaves behind.
This is not just chart folklore. A study of NYSE order-book data by Cont, Kukanov, and Stoikov found that short-term price changes are “mainly driven by the order flow imbalance, defined as the imbalance between supply and demand at the best bid and ask prices,” and that this single variable explains a large share of high-frequency price moves. In plain terms: imbalance is what moves markets fast. When one side overwhelms the other, price jumps through levels without trading much on the way — and that skipped-over area is your FVG. This order-flow logic is the backbone of the wider smart money concepts toolkit, of which the fair value gap is one of the most-used pieces.
The anatomy of an FVG
Every fair value gap is built from three consecutive candles:
- Candle 1 — the setup candle before the move.
- Candle 2 — a large “displacement” candle with a big body that fires in one direction.
- Candle 3 — the candle that follows the displacement.
The gap itself is the space that candle 2’s speed leaves untraded. Concretely: an FVG exists when candle 1’s wick and candle 3’s wick do not overlap. The empty band between them is the imbalance — the slice of price where the market moved so quickly that very little actual buying and selling took place.
No displacement, no gap. A slow, overlapping three-candle sequence is just normal movement. The FVG only appears when candle 2 is a genuine, forceful move that leaves clear air behind it.
Bullish vs. bearish fair value gaps
The direction of the displacement candle tells you which kind of FVG you have.
- Bullish FVG — candle 2 is a strong up candle. The gap sits below current price, in the band between the high of candle 1 and the low of candle 3. Because it sits under price, a bullish FVG is a potential demand area — a spot to watch for buying if price dips back into it.
- Bearish FVG — candle 2 is a strong down candle. The gap sits above current price, in the band between the low of candle 1 and the high of candle 3. It is a potential supply area — a spot to watch for selling if price rallies back into it.
A quick way to remember it: the gap always forms behind a sharp move, and price often comes back to test the area it skipped.
| Bullish FVG | Bearish FVG | |
|---|---|---|
| Displacement candle | Large up candle | Large down candle |
| Gap boundaries | Candle 1 high → candle 3 low | Candle 1 low → candle 3 high |
| Gap location | Below current price | Above current price |
| How traders use it | Watch for buys on a return | Watch for sells on a return |
How to spot a fair value gap
Finding FVGs is a repeatable, mechanical scan — the same on forex, indices, or stocks:
- Look for displacement. Scan for a single large candle (or a tight run of them) that traveled far in one direction with little wick against it. That momentum is your candidate.
- Check the two neighbors. Put candle 1 (before) and candle 3 (after) side by side with the displacement candle in the middle.
- Test for the gap. For a bullish move, ask: is candle 3’s low above candle 1’s high? If yes, the space between them is a bullish FVG. For a bearish move, ask: is candle 3’s high below candle 1’s low? If yes, that space is a bearish FVG.
- Mark the box. Draw a rectangle across that untouched band and extend it to the right so you can see when price returns to it.
Many charting platforms now flag FVGs automatically, but drawing a few by hand first is worth it — it trains your eye to see the imbalance rather than trust an indicator blindly.
The anatomy of an FVG: a worked diagram

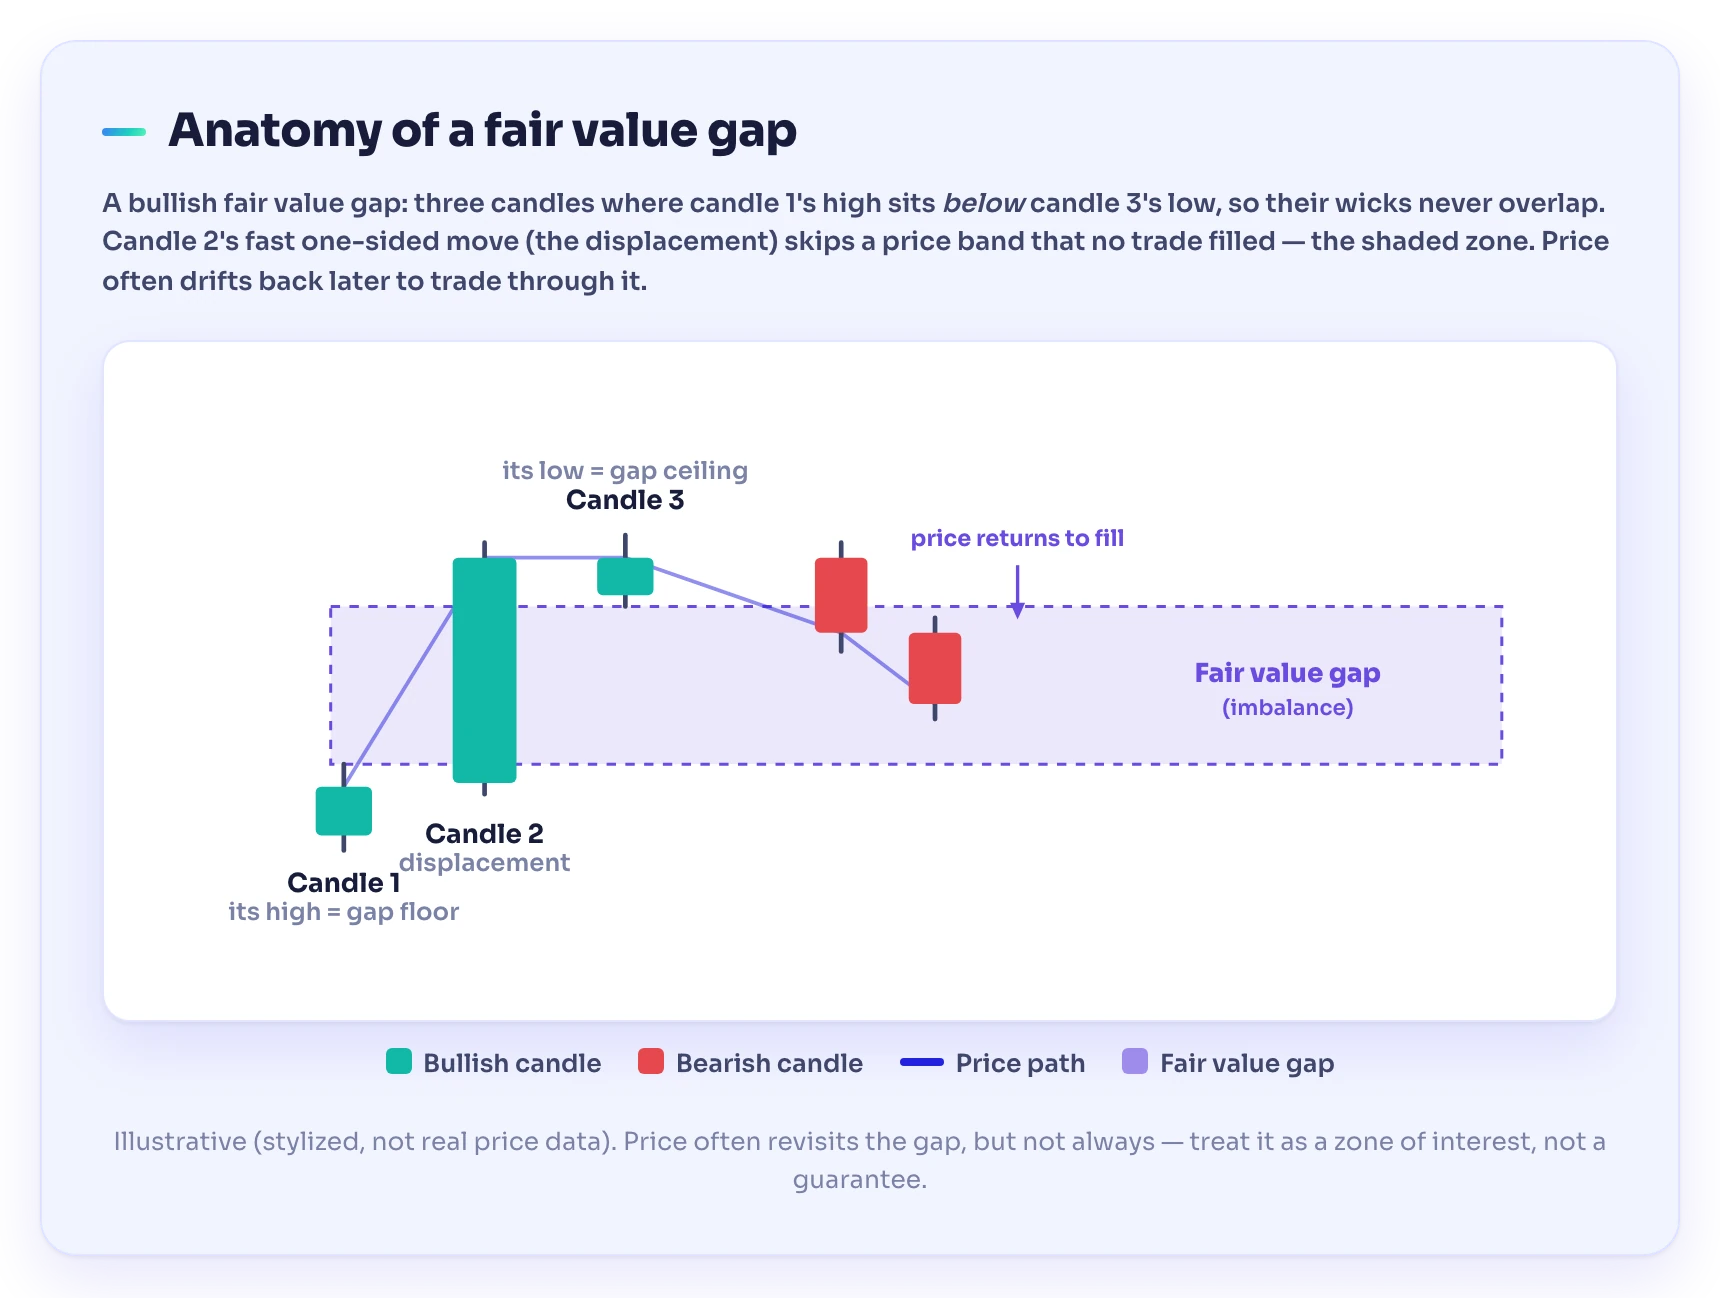
Picture the diagram above. Candle 2 is a tall green displacement candle wedged between an ordinary candle 1 and a candle 3 that opens well above where candle 1 traded. The shaded band’s lower edge is the high of candle 1 and its upper edge is the low of candle 3 — the slice price skipped. Shade it and stretch it to the right, and you have a bullish fair value gap.
The payoff comes on the right of the diagram: price keeps rising, stalls, and drifts back down into the shaded band. As it re-enters the gap, buyers who missed the first move often step in — the return into the zone is the event FVG traders wait for. The box turned a vague “somewhere down there” into a precise area to plan a trade.
Why price returns to “fill” the gap — and why it is only a probability
The popular explanation is that an FVG represents inefficient pricing — a zone the market blew through without letting both sides transact. The theory says markets prefer efficiency, so price tends to drift back to “fill” the void, offering everyone a fairer price, before resuming its path. That is why “imbalance trading” treats a fresh FVG as a magnet.
Not every gap fills: It is a useful mental model — but a tendency, not a law. A 2025 peer-reviewed study of weekend gaps across the Dow Jones, NASDAQ, and DAX found “no strong, universal bias towards closing gaps,” concluding the results “challenge the assumption that weekend gaps necessarily ‘fill’ soon after they open.” Some gaps fill quickly, some much later, and some never — especially when a powerful trend or fresh news is behind the move. So an FVG marks an area of higher probability for a reaction, not a guaranteed reversal. That single distinction separates traders who use FVGs as one input in a plan from those who treat them as a crystal ball and get run over.
How to trade a fair value gap
A fair value gap is a decision area, not an automatic order. A disciplined fair value gap strategy stacks the odds instead of relying on the zone alone:
- Trade with the trend. In an uptrend, favor bullish FVGs for buys and ignore bearish ones; in a downtrend, do the reverse. Fading a strong trend at an FVG is where most beginners lose. If reading trend is still shaky, our technical analysis primer covers the structure that defines one.
- Wait for price to reach the gap. Do not chase the displacement candle. Let price come back into your drawn box.
- Look for confirmation. A rejection candle, a lower-timeframe reversal, or an order block sitting inside the same zone all add confidence. FVG plus a fresh order block at the same price is a classic high-conviction combination.
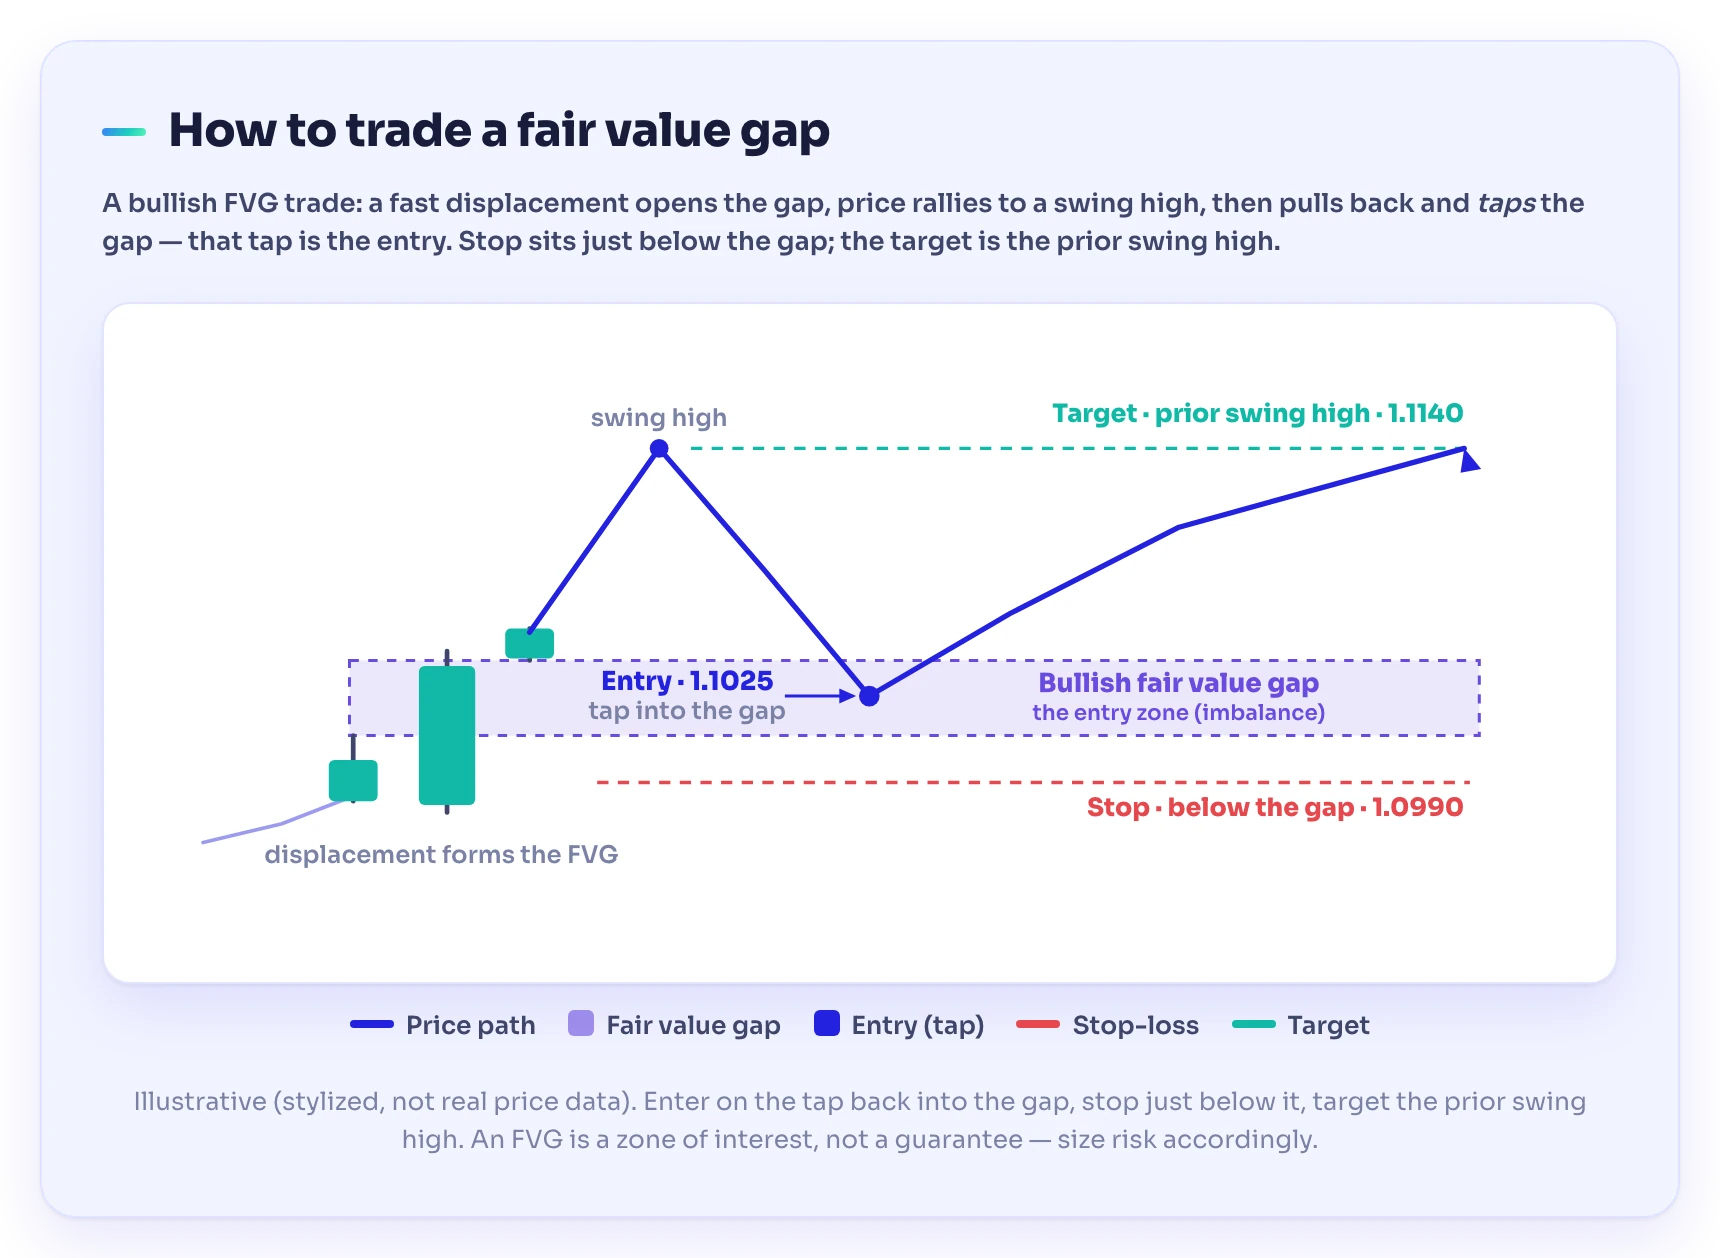
- Place your stop beyond the gap. For a bullish-FVG buy, the stop goes just below the gap’s low; for a bearish-FVG sell, just above its high. If price closes clean through the zone, the imbalance is spent and you want to be out.
- Target the next liquidity area. A natural take-profit is the prior swing high or low, or the next opposing zone — such as a nearby supply or demand zone.
Worked Example: (Illustrative — levels are invented to show the structure of the decision, not the specific price.) A currency pair is trending up. A sharp rally prints a bullish FVG at 1.1000–1.1030. Two days later, price pulls back and dips into the gap at 1.1025, prints a strong bullish rejection candle, and turns. You buy near 1.1025, set a stop at 1.0990 (just below the gap), and target the prior swing high at 1.1140 — roughly 35 pips of risk for 115 pips of reward, a plan built entirely from three candles and a box.

False signals and common mistakes
FVGs fail often enough that risk control matters more than the drawing. Watch for these traps:
- Trading a gap with weak displacement. If candle 2 was small or heavily wicked, the “imbalance” is thin and the zone is unreliable. Demand a genuinely forceful move.
- Ignoring the trend. A bullish FVG inside a strong downtrend is low-quality. Context beats the pattern every time.
- Expecting every gap to fill. As the research above shows, they do not. Never size a position as if the fill is certain.
- Using a stale gap. Once price has already traded back through an FVG, the imbalance is largely resolved; the freshest, untested gaps tend to be the cleanest.
- Skipping confluence. An FVG that lines up with a round number, a session high or low, or a higher-timeframe zone is far stronger than one floating alone.
- Neglecting psychology. No zone survives poor discipline. Our notes on trading psychology explain why traders abandon good plans at exactly the wrong moment.
FVG, order blocks, and supply & demand: how they fit
These ideas are cousins, not rivals, and they come from the same order-flow reasoning.
- A fair value gap is the untraded space left by a fast move.
- An order block is the last opposing candle right before that move — often the origin of the very displacement that created the FVG.
- A supply or demand zone is the broader base the move launched from.
The strongest setups are where these overlap: a bullish FVG that forms just above a fresh demand zone and an order block is three reasons to react at one price. Learning to see them together — rather than hunting any single signal — is what turns a pattern-spotter into a trader.
Keep leveling up
Level Up: Fair value gaps are one tool inside the broader smart-money toolkit — they work best once you can read displacement, structure, and trend as one picture. A structured path, the kind a trading academy and community like TradeGATEHub is built around, beats stitching together fragments from random videos. For a guided route from the basics to a repeatable process — practised on charts before you risk real money — explore the free lessons in the TradeGATEHub Academy.
Frequently asked questions
What is a fair value gap in trading?
A fair value gap (FVG) is a three-candle imbalance where a fast displacement candle leaves a price band untraded — specifically, where the first candle’s wick and the third candle’s wick do not overlap. Traders treat that gap as an area price may revisit before continuing.
How do you identify a fair value gap?
Find a large displacement candle, then check its neighbors. For a bullish FVG, candle 3’s low must sit above candle 1’s high; for a bearish FVG, candle 3’s high must sit below candle 1’s low. The untouched band between those wicks is the gap — box it and extend it to the right.
What is the difference between a bullish and a bearish FVG?
A bullish FVG forms on a strong up-move and sits below current price, so traders watch it for potential buys. A bearish FVG forms on a strong down-move and sits above current price, so traders watch it for potential sells.
Do fair value gaps always get filled?
No. The “gaps get filled” idea is a tendency, not a rule. Peer-reviewed research on price gaps finds no universal bias toward filling — some gaps fill quickly, some later, and some never, especially in strong trends. Treat an FVG as a higher-probability area, not a guaranteed reversal.
Is a fair value gap the same as an order block?
They are related but not identical. An order block is the last opposing candle before a strong move; a fair value gap is the untraded space that same move leaves behind. They often sit right next to each other, and traders frequently use them together for confirmation.
What timeframe is best for trading FVGs?
Higher-timeframe gaps carry more weight because a larger imbalance created them. A common workflow is to mark FVGs on the daily or 4-hour chart, then drop to a lower timeframe like the 15-minute to time an entry when price returns to one.
Sources
- Cont, R., Kukanov, A., & Stoikov, S. (2014). The Price Impact of Order Book Events. Journal of Financial Econometrics, 12(1), 47–88 — finds short-term price changes are mainly driven by order flow imbalance (the imbalance between supply and demand at the best bid/ask). doi.org
- Janse van Rensburg, M., & Van Zyl, T. (2025). Price Gaps and Volatility: Do Weekend Gaps Tend to Close? Journal of Risk and Financial Management, 18(3), 132 — finds “no strong, universal bias towards closing gaps” and challenges the assumption that gaps necessarily fill soon after they open. doi.org
Risk warning. Trading forex, CFDs, and other leveraged products carries a high level of risk and may not be suitable for all investors. Fair value gaps are educational tools, not trading signals, and do not guarantee results. This article is for educational purposes only and does not constitute financial or investment advice.