



Fibonacci retracement for stocks is a way to map where a share price might pause or reverse after a strong move. You draw the tool between a swing low and swing high, and it plots horizontal levels — mainly 38.2%, 50% and 61.8% — that mark potential support or resistance inside the pullback. They are alert zones, not guarantees.
If you want the mechanics of the tool itself — the maths, the ratios, and how the levels are built — start with our full guide to Fibonacci retracement. This article is the stock-specific application: how to draw fibs on equity swing highs and lows, why the 38.2–61.8% zone matters after an earnings run or a gap, and how to combine those levels with moving averages, prior highs, and volume so you are not trading a line in isolation.
Why Fibonacci retracement suits stock charts
Stocks trend, and then they breathe. A large-cap that runs 20% into an earnings beat rarely climbs in a straight line — it gives some of that move back before deciding what to do next. Fibonacci retracement is a framework for that pullback: it takes the size of the prior swing and marks the fractions of it where buyers have historically stepped back in.
The levels come from the Fibonacci number sequence, made famous by the 13th-century mathematician Leonardo of Pisa. Dividing one number in the sequence by the next higher one settles near 0.618 — the “golden ratio,” or 61.8% — while other ratios in the sequence give 23.6% and 38.2%. The 50% level is a common addition that is not actually a Fibonacci number; it comes from the old Dow Theory idea that markets often retrace about half of a prior move.
Three things about equities make these levels genuinely useful:
- Clear swings. Liquid stocks and indices print clean, well-defined swing highs and lows, so the anchor points for the tool are less ambiguous than on a choppy, thin instrument.
- Shared attention. Because so many equity traders watch the same 38.2/50/61.8% levels on the same benchmark names, the levels can become partly self-fulfilling — orders cluster there.
- Session structure. A stock’s regular session (in the US, 9:30–16:00 ET) produces defined daily ranges, which makes swing selection cleaner than on a 24-hour market.
What “retracement” actually means: A retracement is a temporary move against the prevailing trend — a pullback inside an uptrend, or a bounce inside a downtrend. It is not a full reversal. Fibonacci retracement tries to estimate how deep that temporary move might run before the original trend resumes, using fixed fractions of the prior swing.
How to draw Fibonacci retracement on a stock chart

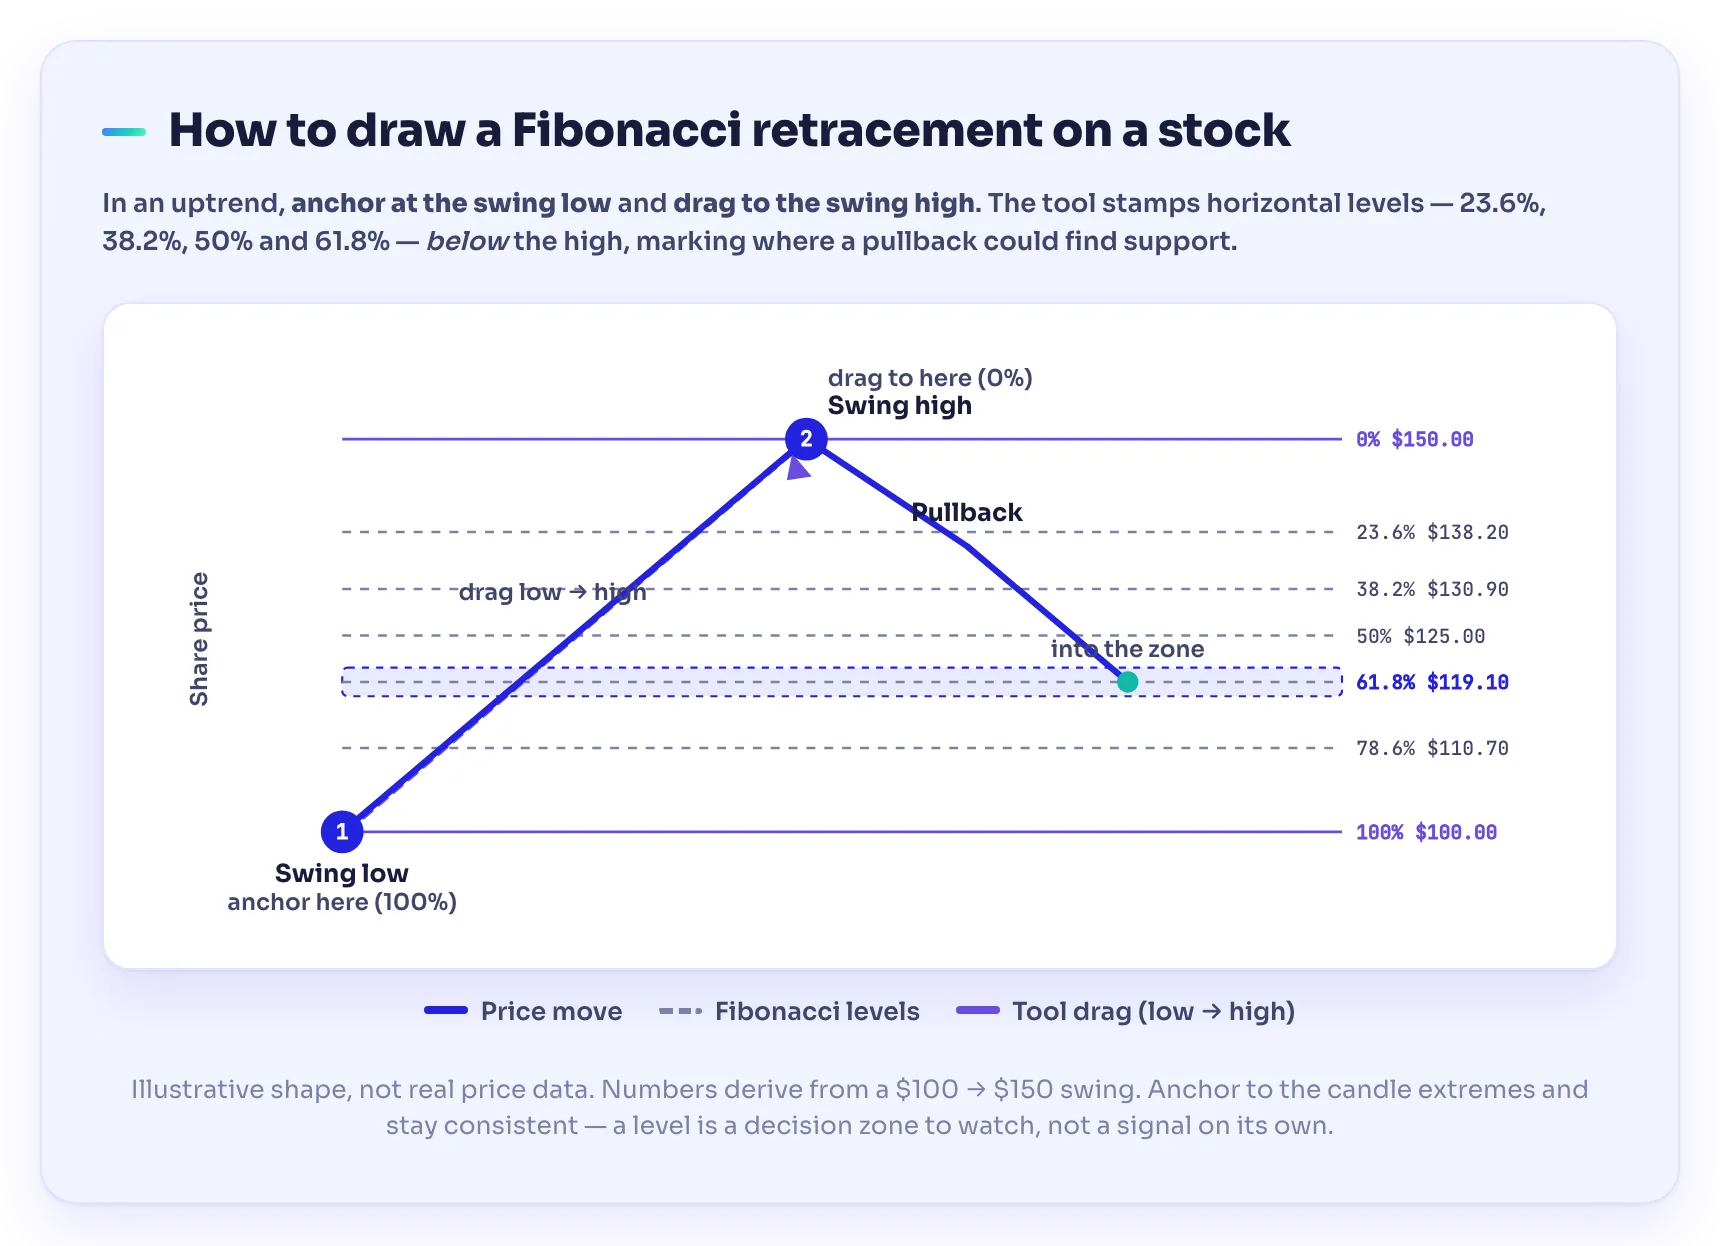
The tool is only as good as the two points you anchor it to. Getting the swing right is the whole skill.
- Identify the dominant swing. Pick the clear, recent price move you want to measure — a defined rally or a defined sell-off on your chosen timeframe. Zoom out enough that the swing is obvious, not a minor wiggle.
- Anchor low-to-high for an uptrend. In an uptrend, click the swing low and drag to the swing high. The retracement levels then appear below the high, showing where a pullback could find support (61.8% sits nearest the low; 23.6% sits nearest the high).
- Anchor high-to-low for a downtrend. In a downtrend, do the reverse — click the swing high and drag to the swing low. The levels now mark where a counter-trend bounce could meet resistance.
- Use the same reference points each time. Most traders anchor to candle wicks (the extreme high and low). Whatever you choose, be consistent, or your levels will drift.
- Read the zone, not the exact line. Treat 38.2–61.8% as a region to watch, not a pixel-perfect price.
Fibonacci does not predict — it flags zones: This is the honest caveat. Fibonacci retracement is probabilistic, not predictive. The levels are, in StockCharts’ words, “not hard reversal points” — they “serve as alert zones for a potential reversal.” Price ignores them constantly. Draw the same swing on the same chart and two traders will anchor slightly differently and get slightly different levels. The tool narrows where to pay attention; it never tells you that a turn will happen. Anyone selling you fib levels as a crystal ball is selling you a story.
The 38.2 / 50 / 61.8% zone: reading equity pullbacks
Not all retracement levels carry equal weight for stock traders. In practice, attention concentrates in the middle of the range.
| Level | What a pullback to it usually signals | Typical read on a strong stock |
|---|---|---|
| 23.6% | A very shallow dip | Strong momentum; the trend barely paused |
| 38.2% | A normal, healthy pullback | First zone buyers watch after a sharp run |
| 50% | A deeper “half-back” pullback | Still normal; common on volatile names |
| 61.8% | A deep retracement (the “golden” level) | Last-ditch trend support; a break below questions the trend |
| 78.6% | Very deep | Trend is in real doubt; often precedes failure |
The rule of thumb equity swing traders use: the shallower the pullback, the stronger the trend. A stock that only gives back 23.6–38.2% before pushing to new highs is showing eager demand. A stock that sinks to 61.8% is testing whether the buyers who drove the rally are still there. A decisive close below the 61.8% level often means the prior swing is no longer in control — many traders treat that as the point where the retracement thesis is wrong.
Worked example — a post-earnings pullback (illustrative): Suppose a large-cap stock gaps up on an earnings beat and rallies from a swing low of $100 to a swing high of $150 — a $50 move. You anchor the Fibonacci tool low-to-high. The key levels land at:
- 38.2%: $150 − (0.382 × $50) = $130.90
- 50%: $125.00
- 61.8%: $150 − (0.618 × $50) = $119.10
Over the next two weeks the stock drifts back and steadies around $120–$125 — the 50–61.8% zone — before turning higher again. The fib levels did not cause the bounce; they gave you a defined region to watch, size a plan, and place a risk level (for example, a stop below the 61.8% line). All figures are illustrative.
Confluence: where Fibonacci earns its keep in equities
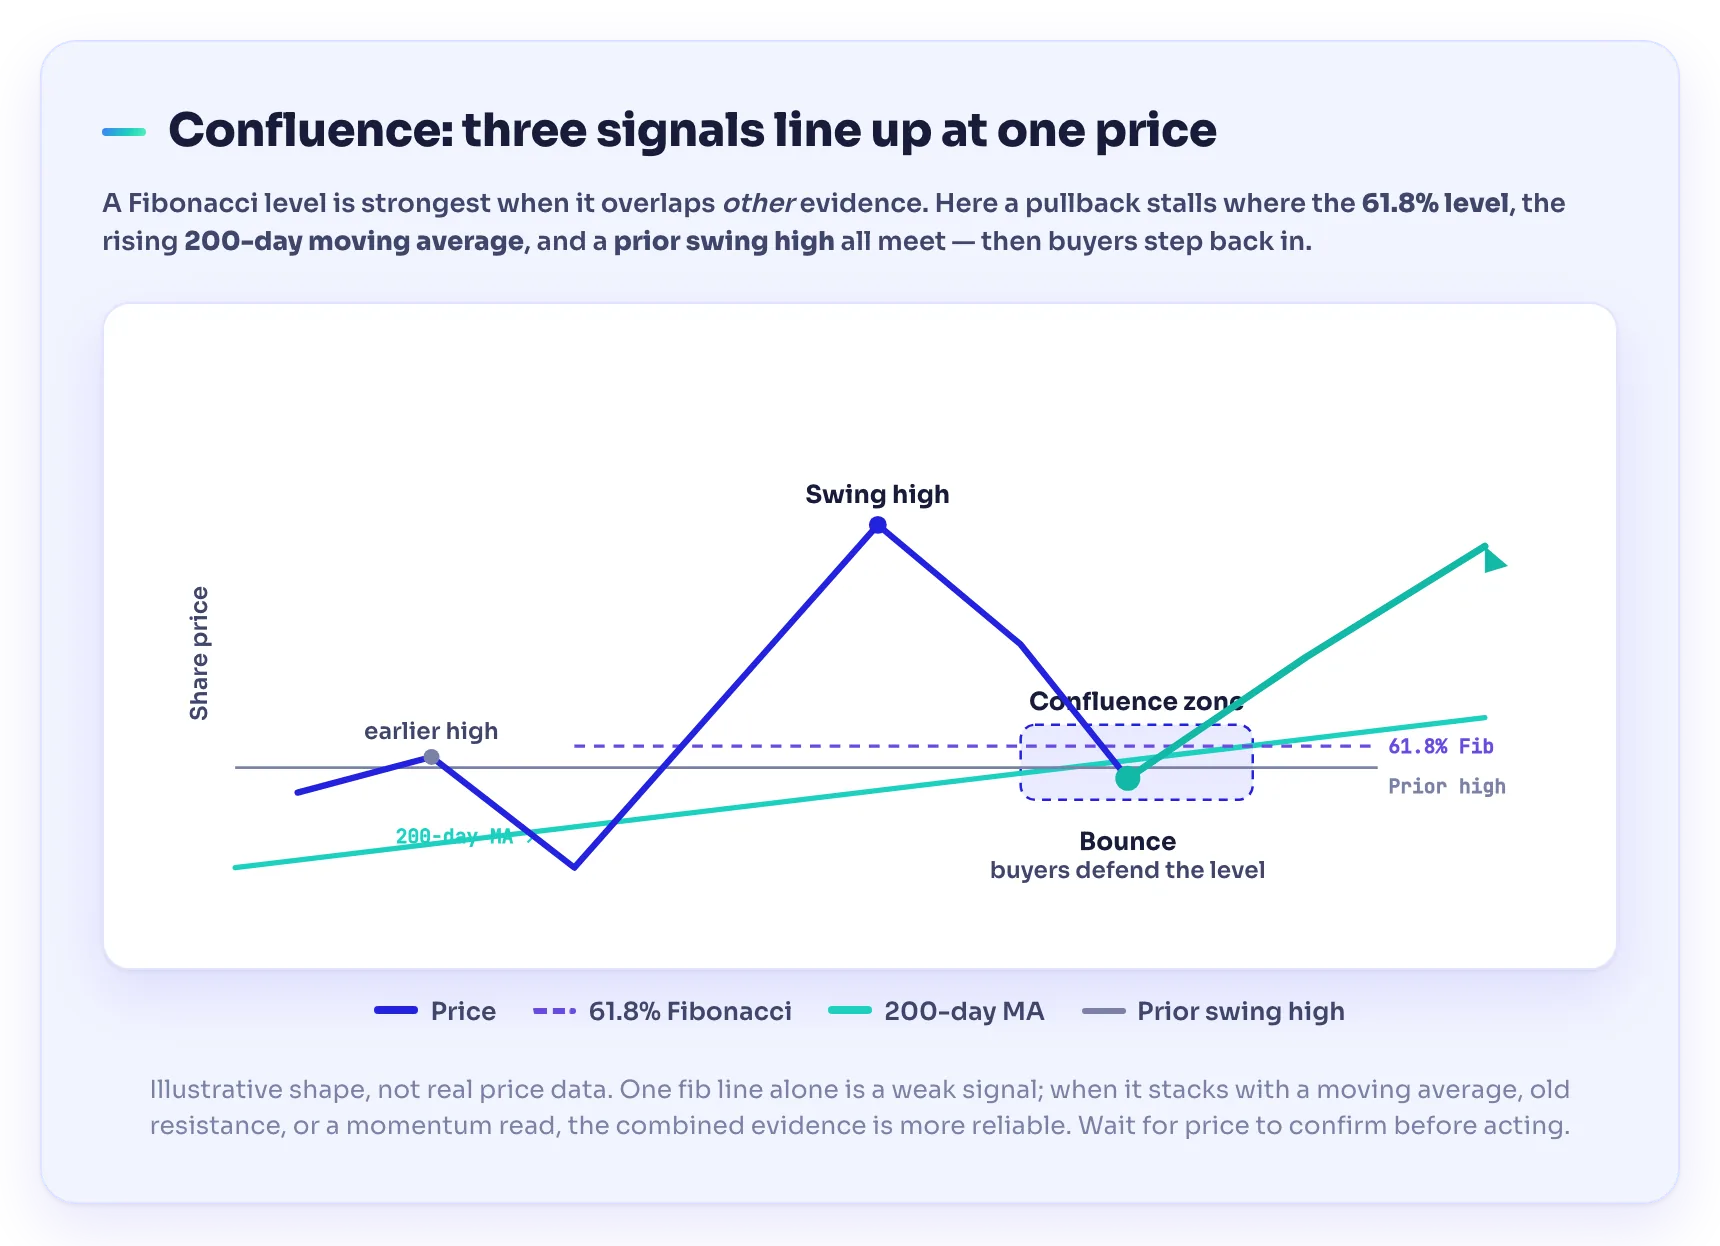
A Fibonacci level on its own is a weak signal. The tool becomes useful when a level lines up with other evidence — what traders call confluence. StockCharts is blunt about this: “Other technical signals are needed to confirm a reversal … The more confirming factors, the more robust the signal.”
For stocks specifically, look for a fib level that coincides with:
- A moving average. A 61.8% retracement that lands on the rising 50-day or 200-day moving average is a classic equity setup — two independent reasons for buyers to defend the same price.
- A prior swing high or gap fill. Old resistance often becomes new support. When a 38.2% or 50% level sits right where the stock previously broke out (or where an earnings gap started), that overlap matters.
- A support or demand zone. A fib level inside a broader supply-and-demand area is stronger than one floating in open space.
- A momentum read. If price reaches the 61.8% level while the RSI indicator is turning up from a low, the pullback and the momentum reset agree.
- Volume. A pullback into the zone on falling volume, followed by a bounce on rising volume, suggests sellers are exhausting and buyers are returning.
When three of these stack at the same price, you have a level worth a plan. When only the fib line is there, be skeptical.
The one thing to remember: Fibonacci retracement does not find turning points by itself. Its job in equities is to give you a short list of prices to watch during a pullback — then you wait for confluence and a confirmation from price before acting. The line narrows the search; the confirmation makes the trade.
Common mistakes stock traders make with fibs
- Anchoring to the wrong swing. Measuring a tiny intraday wiggle instead of the dominant move produces levels that mean nothing. Pick the obvious swing.
- Forcing a level to “work.” Redrawing the tool until a level matches where price already turned is curve-fitting, not analysis. Set it once on the clear swing and leave it.
- Trading the line blind. Buying the 61.8% level with no confluence and no confirmation is guessing. Wait for price to react.
- Ignoring the trend. Fibs measure retracements within a trend. Using them to pick a bottom in a stock that is in a genuine downtrend fights the tape.
- Forgetting the gap risk. Stocks can gap through a fib level overnight on news. A level is a plan, not a guaranteed fill — which is why a defined risk level matters more than the entry.
- Overloading the chart. Ten swings, forty levels, and the whole screen turns to noise. One clean swing at a time.
Fibonacci retracement pairs naturally with the wider discipline of technical analysis and with the mental side of trading — sitting on your hands until the zone actually reacts is as much about trading psychology as it is about the tool.
Level Up: If you are learning to read pullbacks on live equity charts, a structured, community-led academy like TradeGATEHub — with free trading education and a live academy — is a low-pressure way to practice drawing fibs and spotting confluence before you risk real money.
Frequently asked questions
What is Fibonacci retracement in stock trading?
Fibonacci retracement is a tool that marks potential support or resistance levels inside a pullback. You draw it between a stock’s swing low and swing high, and it plots horizontal lines at ratios of that move — mainly 38.2%, 50% and 61.8%. Those levels are alert zones to watch, not guaranteed reversal points.
How do you draw Fibonacci retracement on a stock chart?
Pick the clear, dominant swing on your timeframe. In an uptrend, anchor the tool at the swing low and drag to the swing high, so the retracement levels appear below the high as possible support. In a downtrend, do the reverse. Anchor to the candle extremes and keep your reference points consistent.
Which Fibonacci level is most important for stocks?
The 61.8% level — the “golden ratio” — gets the most attention because it is the deepest common retracement before a trend is questioned. The 38.2% and 50% levels matter for shallower, healthier pullbacks. A decisive close below 61.8% often signals the prior swing is no longer in control.
Is the 50% level a real Fibonacci number?
No. The 50% retracement is not derived from the Fibonacci sequence. It is included by convention, based on the older Dow Theory observation that markets often retrace about half of a prior move. Traders still watch it, but it is worth knowing it sits on different reasoning than 38.2% or 61.8%.
Does Fibonacci retracement actually work on stocks?
It has no predictive power on its own — the levels are alert zones, and price ignores them often. Their value comes from confluence: when a fib level lines up with a moving average, a prior high, a demand zone, or a momentum signal, the combined evidence is more reliable than any single line. Always confirm with price before acting.
What timeframe is best for Fibonacci retracement on stocks?
Higher timeframes (daily and weekly) tend to produce cleaner, more respected swings because more participants watch them. Intraday traders use it on lower timeframes, but the levels are noisier. Match the timeframe to your holding period, and make sure the swing you anchor to is obvious rather than a minor fluctuation.
Sources
- StockCharts ChartSchool — Fibonacci Retracements — reference for the standard retracement ratios (23.6%, 38.2%, 50%, 61.8%), how the levels are drawn from a significant advance or decline, the note that the 50% level is not a Fibonacci number (it stems from Dow Theory), and the caveat that the levels “are not hard reversal points” but “serve as alert zones,” with reversals confirmed by candlesticks, momentum, volume or chart patterns. chartschool.stockcharts.com
- FOREX.com Trading Academy — Fibonacci Theory: Sequence, Ratios & Retracement — reference on the origin of the ratios in the Fibonacci number sequence (Leonardo of Pisa) and how dividing adjacent numbers in the sequence produces the 0.618 / 61.8% “golden ratio” used for retracement levels. forex.com
Risk warning. Trading and CFDs carry a high level of risk and may not be suitable for all investors. Fibonacci retracement is an educational tool, not a trading signal, and does not guarantee results — the levels are probabilistic alert zones that price frequently ignores, and any level can fail. This article is for educational purposes only and does not constitute financial advice.