



A golden cross is a chart signal that forms when a shorter moving average — usually the 50-day — crosses above a longer one, usually the 200-day. Traders read it as confirmation that a downtrend has bottomed and a longer-term uptrend may be taking hold. Its mirror image, the death cross, is the 50-day crossing below the 200-day.
Both are among the most widely-watched signals in technical analysis, quoted in financial headlines whenever a major index like the S&P 500 triggers one. This guide covers exactly what a golden cross is, how the death cross mirrors it, why traders watch them, how to actually trade the crossover (confirmation, volume, and the false-signal problem), and the one thing most headlines leave out: these are lagging indicators, and the data on what happens next is messier than the drama suggests.
What is a golden cross?
A golden cross is a bullish crossover: a short-term moving average rising up through a long-term moving average. The classic version uses the 50-day and 200-day simple moving averages (SMAs) of closing price. When the faster 50-day line climbs above the slower 200-day line, recent momentum has overpowered the longer trend, and traders take it as a sign the market may be shifting from bearish to bullish.
A moving average is just the average closing price over a set number of days, recalculated each day so the line “moves” with price. The 50-day tracks the medium-term trend; the 200-day is the benchmark for the long-term trend. A golden cross is the moment those two agree that direction has turned up.
Investopedia describes the golden cross as unfolding in three stages: a downtrend bottoms out as buyers overpower sellers; the shorter average then crosses above the longer one, confirming the reversal; and finally a continuing uptrend develops, with the moving averages acting as support on pullbacks. Notice the order — the bottom comes first, and the cross only confirms it afterward. That sequencing is the whole reason a golden cross is a confirmation tool, not a crystal ball.
What is a death cross?
The death cross is the exact mirror image — a bearish crossover. It forms when the short-term moving average (again, typically the 50-day) drops below the long-term 200-day average. Where the golden cross says “downward momentum is exhausted,” the death cross says “upward momentum is exhausted,” and warns that a deeper decline may be coming.
The name is dramatic, and financial media lean into it: the death cross preceded several of the worst bear markets of the past century, including 1929, 1974, and 2008. But that reputation is built partly on selection bias — cherry-picking the crashes it foreshadowed while ignoring the many times it signaled nothing worse than a routine pullback. We will come back to what the data actually shows, because it is not what the ominous name implies.
Golden cross vs death cross
If you strip away the labels, the two signals are the same event pointing in opposite directions. Here is the side-by-side:
| Golden cross | Death cross | |
|---|---|---|
| What happens | 50-day MA crosses above 200-day MA | 50-day MA crosses below 200-day MA |
| Momentum read | Short-term strength overtakes long-term | Short-term weakness overtakes long-term |
| Bias | Bullish (possible new uptrend) | Bearish (possible new downtrend) |
| Typical use | Confirm a bottom / trend-follow long | Confirm a top / reduce risk, hedge, or short |
| Timing | Lagging — fires after the low | Lagging — fires after the high |
The key phrase in that table is lagging. Because both signals are built from 50 and 200 days of past prices, they can only ever confirm a move that has already begun. By the time a golden cross prints, the low is often weeks and a double-digit percentage move behind you. That is not a flaw to be fixed — it is the nature of the tool, and trading it well means accounting for it rather than pretending it predicts turns in advance.
Why do traders watch the golden cross?
Three reasons it earns the attention:
- It filters trend. The 50/200 relationship is a clean, objective definition of “is the long-term trend up or down?” — no interpretation required. Many systematic and trend-following strategies use it as a regime filter: be long when the 50-day is above the 200-day, defensive when it isn’t.
- It’s self-reinforcing. Because so many traders, funds, and algorithms watch the same 50/200 lines, the levels carry weight simply through crowd behavior. A widely-known signal can move markets partly because everyone is acting on it at once.
- It’s a headline event. When a major index crosses, it makes the financial press, which pulls in sidelined buyers and adds fuel. This is exactly why the S&P 500’s 50-day-over-200-day cross is one of the most-cited bullish signals in the market.
That said, “widely watched” is not the same as “reliably profitable.” Popularity explains the attention; it does not by itself prove an edge.
The golden cross diagram, step by step

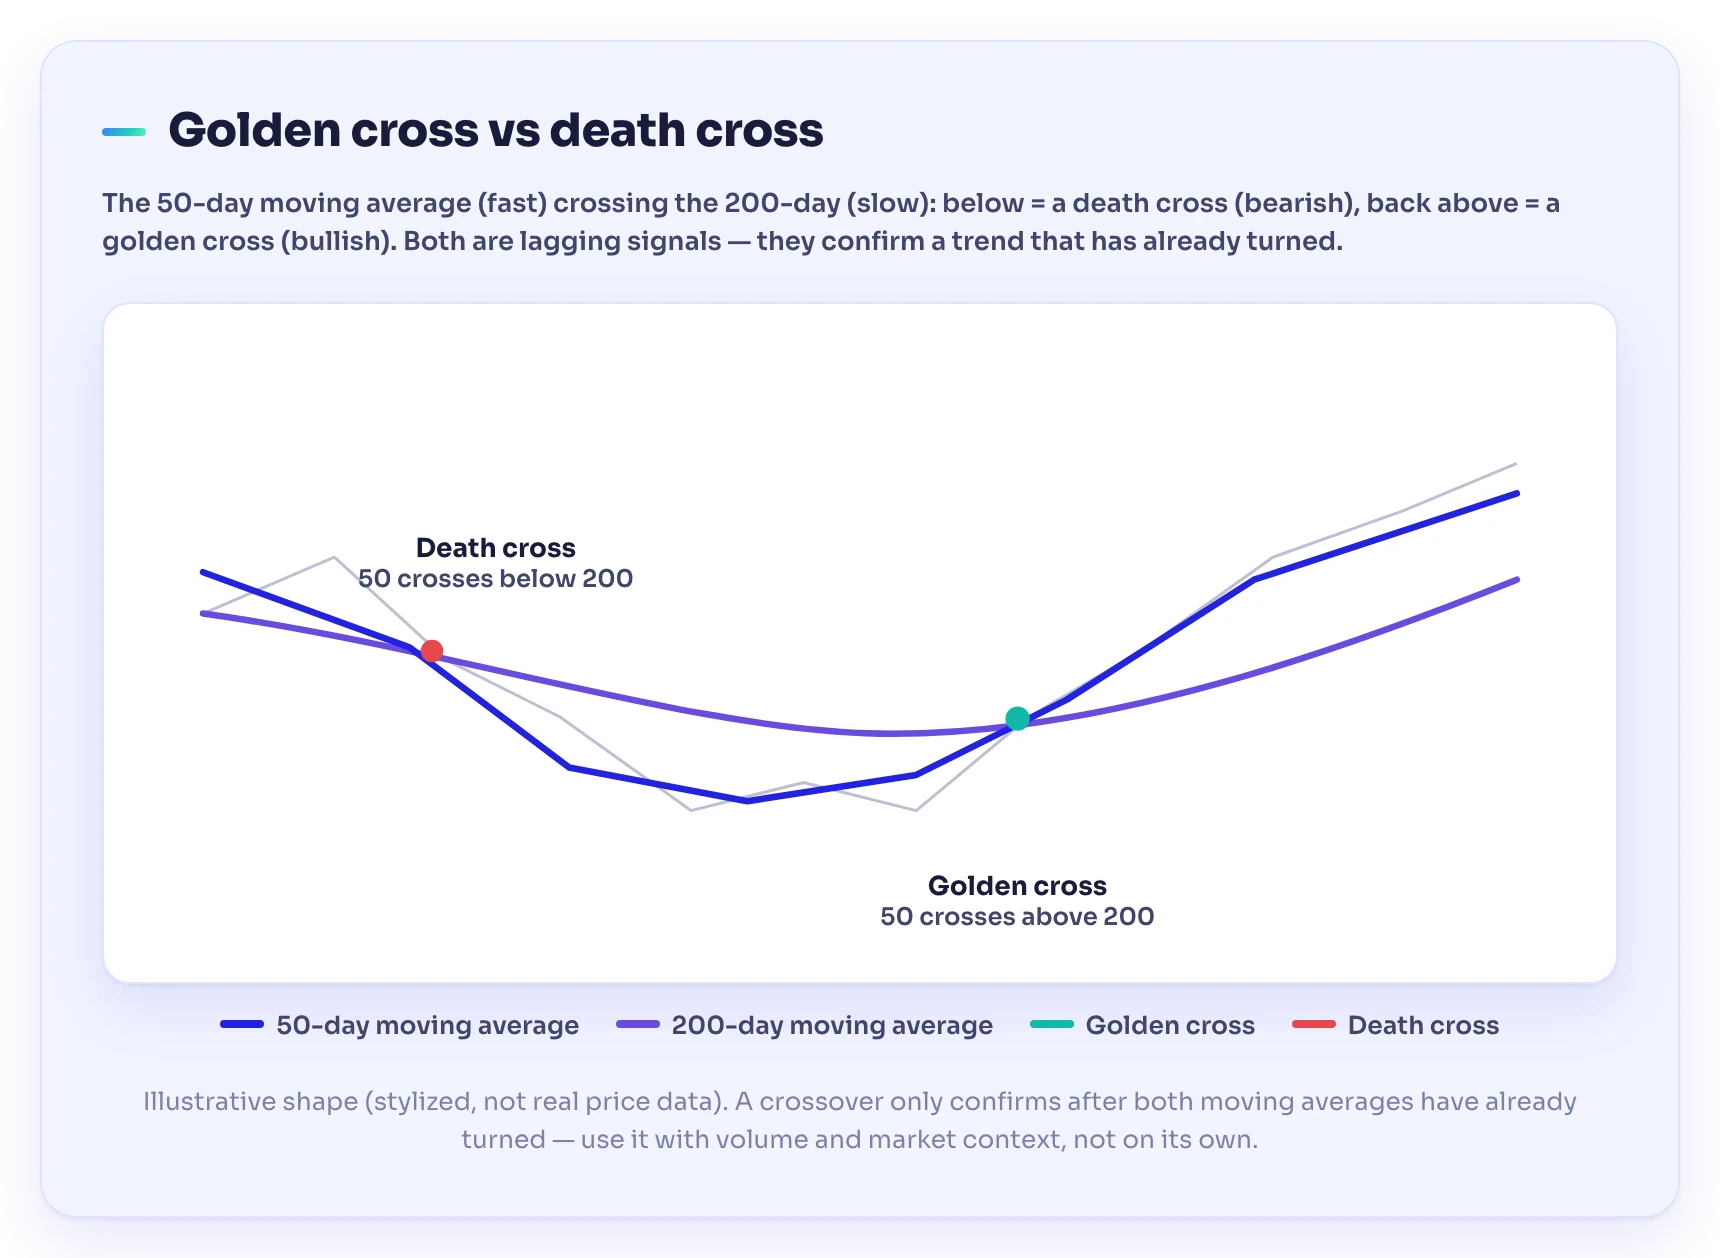
An illustrative golden cross: price bottoms, the 50-day moving average turns up and crosses above the flattening 200-day, and an uptrend follows. The earlier death cross — where the 50-day fell below the 200-day — is marked for contrast. Stylized lines for teaching, not real price data.
Read the diagram left to right and the logic falls out:
- The prior downtrend. Price is falling. The 50-day line sits below the 200-day — the market is in a death-cross regime, and the earlier crossover down is marked on the chart.
- The bottom. Selling dries up and price stops making new lows. The 50-day, which reacts faster, flattens and begins to curl upward while the 200-day is still drifting down or going sideways.
- The cross. The rising 50-day line pushes up through the 200-day line. This is the golden cross itself — the confirmation that medium-term momentum has overtaken the long-term trend.
- The follow-through. Price trends higher, and on pullbacks the moving averages often act as support. The uptrend stays “intact” as long as the 50-day holds above the 200-day.
Checkpoint: The golden cross happens after the bottom, not at it. The signal trades certainty for lateness — you give up catching the exact low in exchange for waiting until the trend is confirmed. That is the deal every crossover offers: later, but surer. Read it as a confirmation tool, never a bottom-picker.
How to trade a golden cross

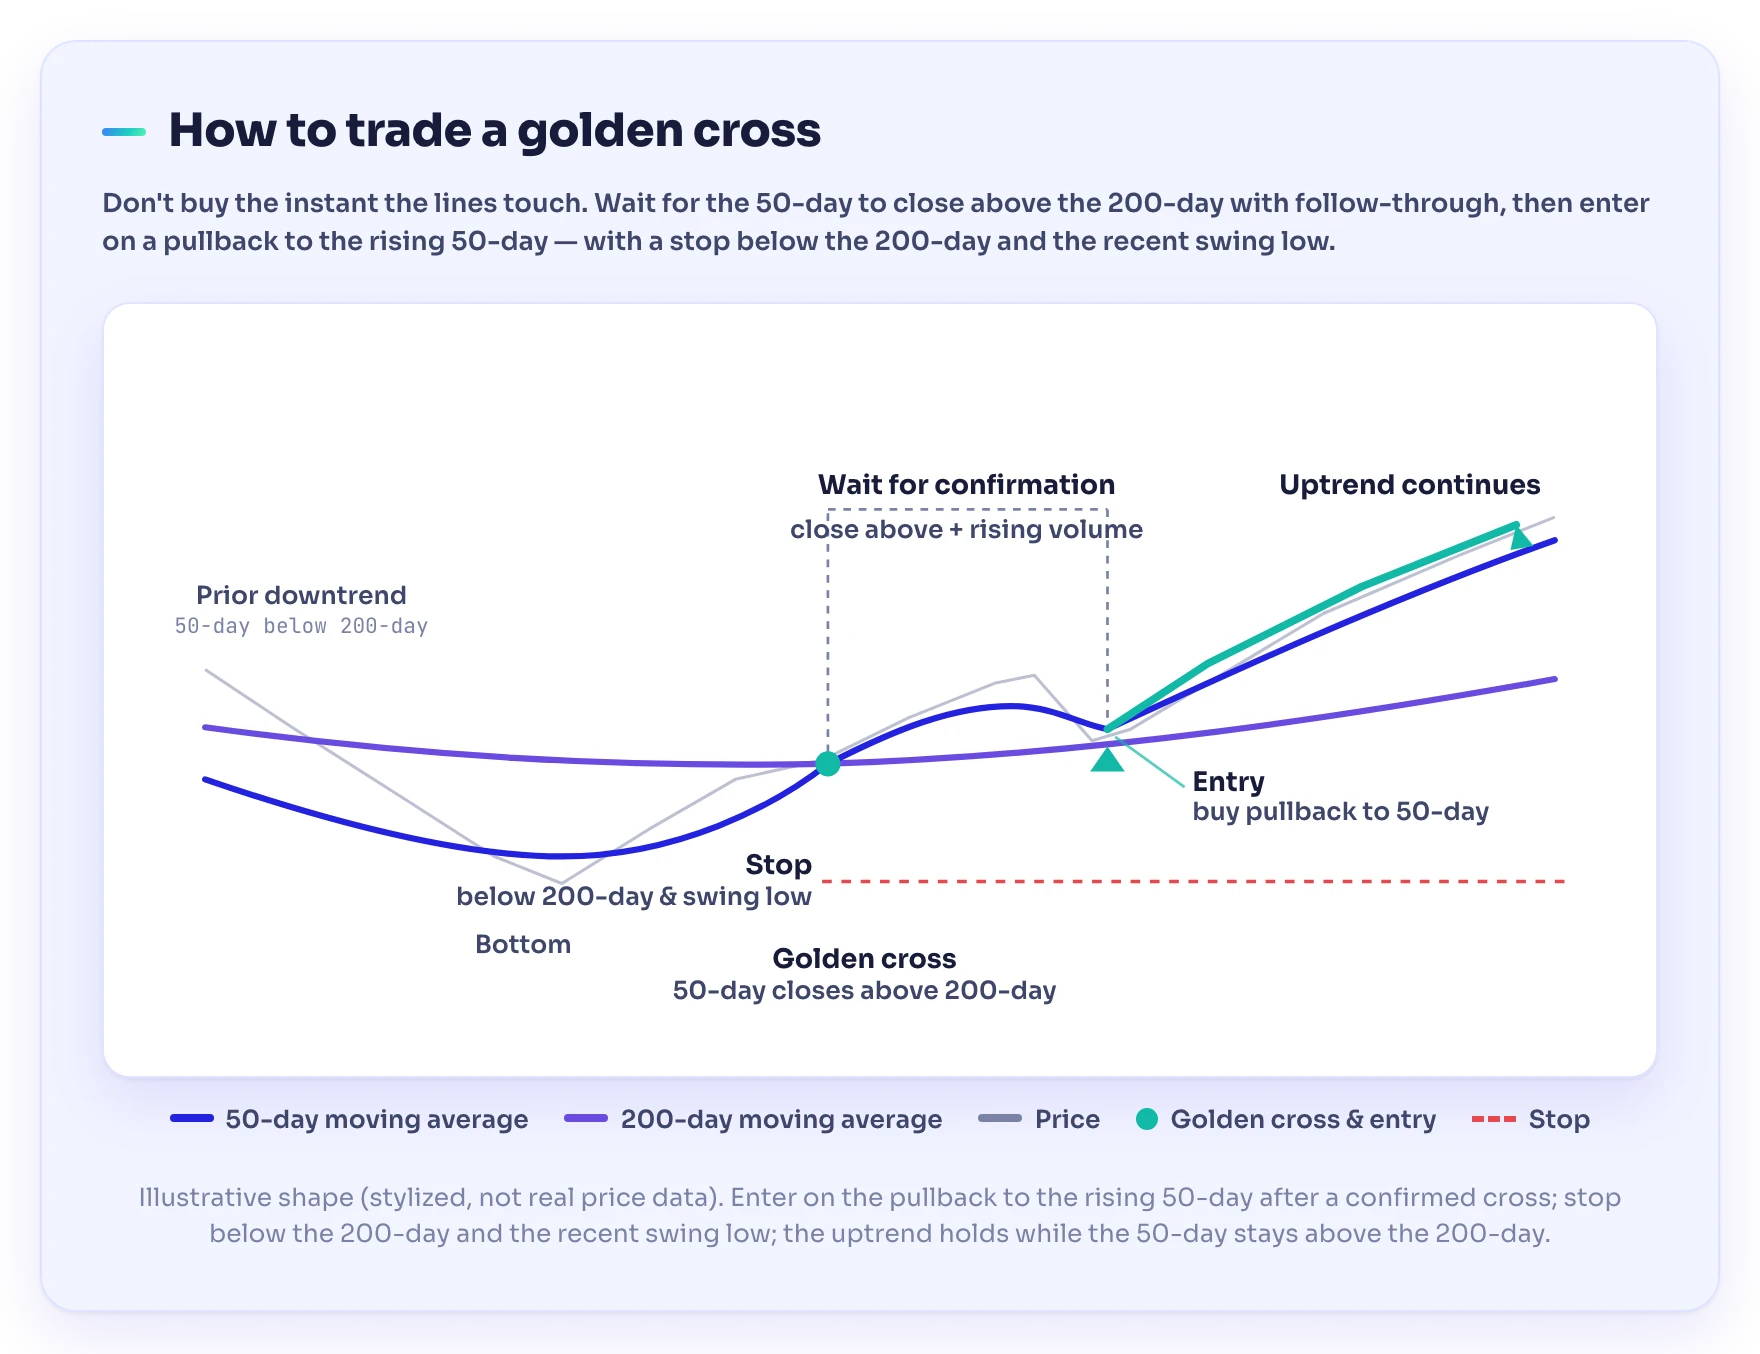
The trade setup: wait for the 50-day to close above the 200-day (the golden cross) with follow-through, enter on the pullback to the rising 50-day, and place a stop below the 200-day and the recent swing low. Stylized lines for teaching, not real price data.
A crossover on its own is a weak edge. What turns it into a usable approach is treating it as one input among several. A disciplined checklist:
- Wait for the close, not the touch. Require the 50-day to close above the 200-day, ideally with a day or two of follow-through, rather than acting the instant the lines kiss. Intraday crosses that reverse by the close are a common trap.
- Demand volume. A golden cross carries more weight when the move up through the 200-day happens on rising trading volume — Investopedia notes that high volume generally reinforces the signal. A cross on thin, fading volume is more likely to fail.
- Confirm with a faster tool. Because the crossover lags, pair it with a momentum indicator that turns sooner, like the MACD. When a shorter-term momentum signal agrees with the longer-term regime change, you have confluence instead of a single lagging trigger.
- Define risk before you enter. Decide your stop and position size first. A common structure is a stop below the recent swing low or below the 200-day line — if price falls back under the level that was supposed to be support, the thesis is wrong and you exit small.
- Use it as a filter, not a countdown. Many traders don’t buy the cross itself at all; they use “50 above 200” as permission to take other long setups — pullbacks, breakouts — and stand aside when the 50-day is below. That sidesteps the lateness problem entirely.
A simple illustrative example. Suppose an index has fallen for months, then stabilizes. Over a few weeks the 50-day flattens, curls up, and closes above the 200-day on a clear jump in volume, while the MACD has already crossed bullish. A trader using the golden cross as a filter now looks to buy the next pullback to the rising 50-day line, placing a stop just below it. The numbers here are invented; the structure — regime filter, momentum confirmation, defined risk — is the point.
The honest caveat: lagging signals and false alarms
Here is what the headlines skip. Because the golden and death crosses are built from long look-back windows, they lag badly and produce plenty of false signals — and the historical returns often run opposite to the emotional label.
The Name Oversells the Danger: The death cross is the clearest case of a signal’s reputation running ahead of its record. Despite the terrifying name, it has been followed by above-average short-term returns many times since 1992. Per Fundstrat research cited in Barron’s, the S&P 500 was higher a year after a death cross about two-thirds of the time, averaging a 6.3% gain. And Nautilus Research found that across 22 Nasdaq Composite death crosses from 1971 to 2022, returns averaged roughly 2.6% after one month, 7.2% after three, and 12.4% after six — about double the index’s typical returns over those windows. More often it has marked a coincident low than a leading warning — “a coincident indicator of market weakness rather than a leading one.”
Two practical lessons follow:
- Whipsaws in range-bound markets. When price chops sideways with no real trend, the 50-day and 200-day can cross back and forth, firing golden-then-death-then-golden signals that each lose a little. Crossovers are trend tools; applied to a trendless market they mostly generate noise and losses.
- The signal is late by design. In a fast V-shaped recovery, the golden cross can arrive well after a large chunk of the rebound is already gone. That is the cost of waiting for confirmation, and it is why the crossover pairs best with faster tools and firm risk rules.
None of this makes the golden cross useless — it makes it a context tool. It tells you which side of the long-term trend you’re on and reinforces trades that agree with it. It does not call exact tops or bottoms, and anyone selling it as a guaranteed buy or sell trigger is overselling it. Sitting out the chop and honoring your stop when a cross fails matters more than the signal itself — a discipline our guide to trading psychology digs into.
Common golden cross mistakes to avoid
- Buying the instant the lines touch. Wait for a confirmed close and follow-through; intraday crosses reverse constantly.
- Ignoring volume. A cross on weak volume is the classic false signal. No participation, no conviction.
- Trading crossovers in a range. In a sideways market the signal whipsaws. If there’s no trend, there’s nothing for the cross to confirm.
- Treating the death cross as a sell-everything alarm. History shows it more often precedes a rebound than a crash. Use it to manage risk, not to panic.
- Forgetting it lags. Don’t expect the cross to nail the low or high. It confirms a move already underway.
- Skipping the stop. No crossover is a guarantee. A defined stop is what keeps a run of false signals survivable.
Keep leveling up
Level Up: The golden cross is one signal in a much larger toolkit, and it works best read alongside trend structure, volume, and faster momentum tools rather than trusted alone. The fastest way to internalize it is to mark up live charts, spot the 50/200 relationship on real indices, and paper-trade the setup before risking money. Learning inside a trading community and academy like TradeGATEHub — where you can pressure-test your reads against other traders — tends to beat studying in isolation. Start with the full chart patterns cheat sheet for the broader playbook, then explore the free lessons in the TradeGATEHub Academy.
Frequently asked questions
What is a golden cross in trading?
A golden cross is a bullish chart signal that forms when a short-term moving average — typically the 50-day — crosses above a long-term moving average, usually the 200-day. It suggests a downtrend has bottomed and a longer-term uptrend may be starting. Because it’s built from past prices, it confirms a move rather than predicting one.
What is the difference between a golden cross and a death cross?
They are mirror images. A golden cross is the 50-day moving average crossing above the 200-day (bullish); a death cross is the 50-day crossing below the 200-day (bearish). Both signal that short-term momentum has overtaken the long-term trend — the golden cross to the upside, the death cross to the downside.
Which moving averages make a golden cross?
The standard golden cross uses the 50-day and 200-day simple moving averages, most famously on indexes like the S&P 500. Shorter-term and day traders sometimes use faster pairs (for example the 5-day and 15-day), but the longer the periods, the stronger and more lasting the signal tends to be.
Is a golden cross bullish or bearish?
Bullish. It marks the point where medium-term momentum overtakes the long-term trend to the upside and is often read as confirmation that a new uptrend may be underway. The bearish counterpart is the death cross.
Is the death cross always bad news?
No. Despite the name, the death cross has frequently been followed by above-average returns. Per research cited by Investopedia, the S&P 500 was higher a year after a death cross about two-thirds of the time (averaging a 6.3% gain), and Nasdaq death crosses were followed by above-average gains over the next one, three, and six months. It’s better read as a coincident sign of weakness than a reliable crash warning.
Is the golden cross a reliable signal?
It’s a widely-watched trend filter, not a standalone edge. It lags because it’s built from 50 and 200 days of price, and it whipsaws in range-bound markets. It works best combined with volume, a faster momentum indicator, and strict risk management — and never traded as a guaranteed buy or sell trigger.
Sources
- Investopedia. Golden Cross Pattern Explained With Examples and Charts — confirms a golden cross forms when a short-term moving average (e.g. the 50-day) crosses above a long-term one (e.g. the 200-day), that it is a lagging indicator to be used with other tools, that high trading volume reinforces it, that the S&P 500 50/200 cross is one of the most popular bullish signals, and the three-stage structure (bottom → crossover confirmation → continuing uptrend). investopedia.com
- Investopedia. Death Cross Definition: How and When It Happens — confirms the death cross is the 50-day crossing below the 200-day, that despite the name it has been followed by above-average short-term returns many times since 1992, that (per Fundstrat/Barron’s) the S&P 500 was higher a year later about two-thirds of the time averaging 6.3%, that Nautilus Research found Nasdaq death crosses averaged ~2.6%/7.2%/12.4% at 1/3/6 months, and that it is a coincident rather than leading indicator. investopedia.com
Risk warning. Trading stocks, forex, CFDs, and other leveraged products carries a high level of risk and may not be suitable for all investors. The golden cross and death cross are educational technical-analysis tools, not trading signals, and do not guarantee results. Past performance and illustrative examples do not predict future outcomes. This article is for educational purposes only and does not constitute financial or investment advice.