



The head and shoulders pattern is a bearish reversal chart pattern that marks the end of an uptrend. It forms three peaks — a left shoulder, a higher head, and a lower right shoulder — sitting on a support line called the neckline. When price breaks below that neckline, the pattern is confirmed and a downtrend is expected to follow.
A fixture of Wall Street chart-reading since the 1930s, it is one of the most recognized formations in technical analysis, and it appears across stocks, forex, and crypto. This guide covers what the pattern is, the psychology that builds it, how to identify a valid one, exactly how to trade the neckline break, the inverse (bullish) version, and the mistakes that turn a textbook setup into a losing trade.
What is a head and shoulders pattern?
A head and shoulders top is a reversal pattern that appears after an uptrend and signals that buyers are losing control. It has four parts:
- The left shoulder — price rallies to a new high, then pulls back. This is the last confident push of the existing uptrend.
- The head — price rallies again to a higher high than the left shoulder, then falls back to roughly the same level as the previous low. The head is the tallest of the three peaks.
- The right shoulder — price rallies a third time but fails to reach the height of the head, making a lower high — usually near the level of the left shoulder — before rolling over. This lower peak is the warning that momentum has broken.
- The neckline — a support line drawn across the two lows (the reaction lows on either side of the head). It can be horizontal or slightly sloped.
When price closes below the neckline, the pattern is complete and the prior uptrend is considered reversed. Because the trend that preceded the peaks was up and the signal points down, the formation is classed as a reversal pattern, not a continuation.
It was described by Richard Schabacker in his 1932 Technical Analysis and Stock Market Profits and codified by Robert Edwards and John Magee in the 1948 classic Technical Analysis of Stock Trends — close to a century of documentation. It remains one of the most-studied setups in the field because its shape maps so cleanly onto a shift in the balance between buyers and sellers.
Decode this: Three terms do all the work in this pattern: Neckline — the support line drawn across the two reaction lows on either side of the head; the pattern’s trigger line. The break — a decisive close below the neckline. Before it you have a forming shape, not a signal. Measured move — the vertical height from the head down to the neckline, projected the same distance below the break to set the target.
How the head and shoulders forms — and the psychology behind it
The three peaks are not random; they trace a trend running out of fuel.
- The left shoulder. The uptrend is healthy. Buyers push to a new high, take some profit, and price dips. So far this looks like a normal pullback.
- The head. Buyers pile back in and drive price to an even higher high — the last hurrah. But the rally is thinner than it looks: volume often fails to keep pace with the new high. When price falls back to the prior low, it defines the neckline support.
- The right shoulder. Buyers try once more, but this time they can’t reach the previous high. That lower high is the crucial tell — demand has weakened, and every trader watching the chart can see the rally failing. Volume on this third push is usually the lightest of the three.
- The neckline break. With three failed attempts to hold the highs, sellers take over. Price breaks below the neckline, trapping the buyers who bought near the head and the right shoulder. Their stop-losses and forced exits accelerate the decline.
Understanding this sequence is the point. The pattern is the market printing “the buyers are exhausted” in a shape you can see — the same trend-reversal logic Charles Dow was writing about in the 1900s, now paired with the discipline covered in our guide to trading psychology. The lower right shoulder is your first evidence; the neckline break is your confirmation.
How to identify a valid head and shoulders
Most failed head-and-shoulders trades come from calling a pattern “valid” before it confirms. Use these filters.

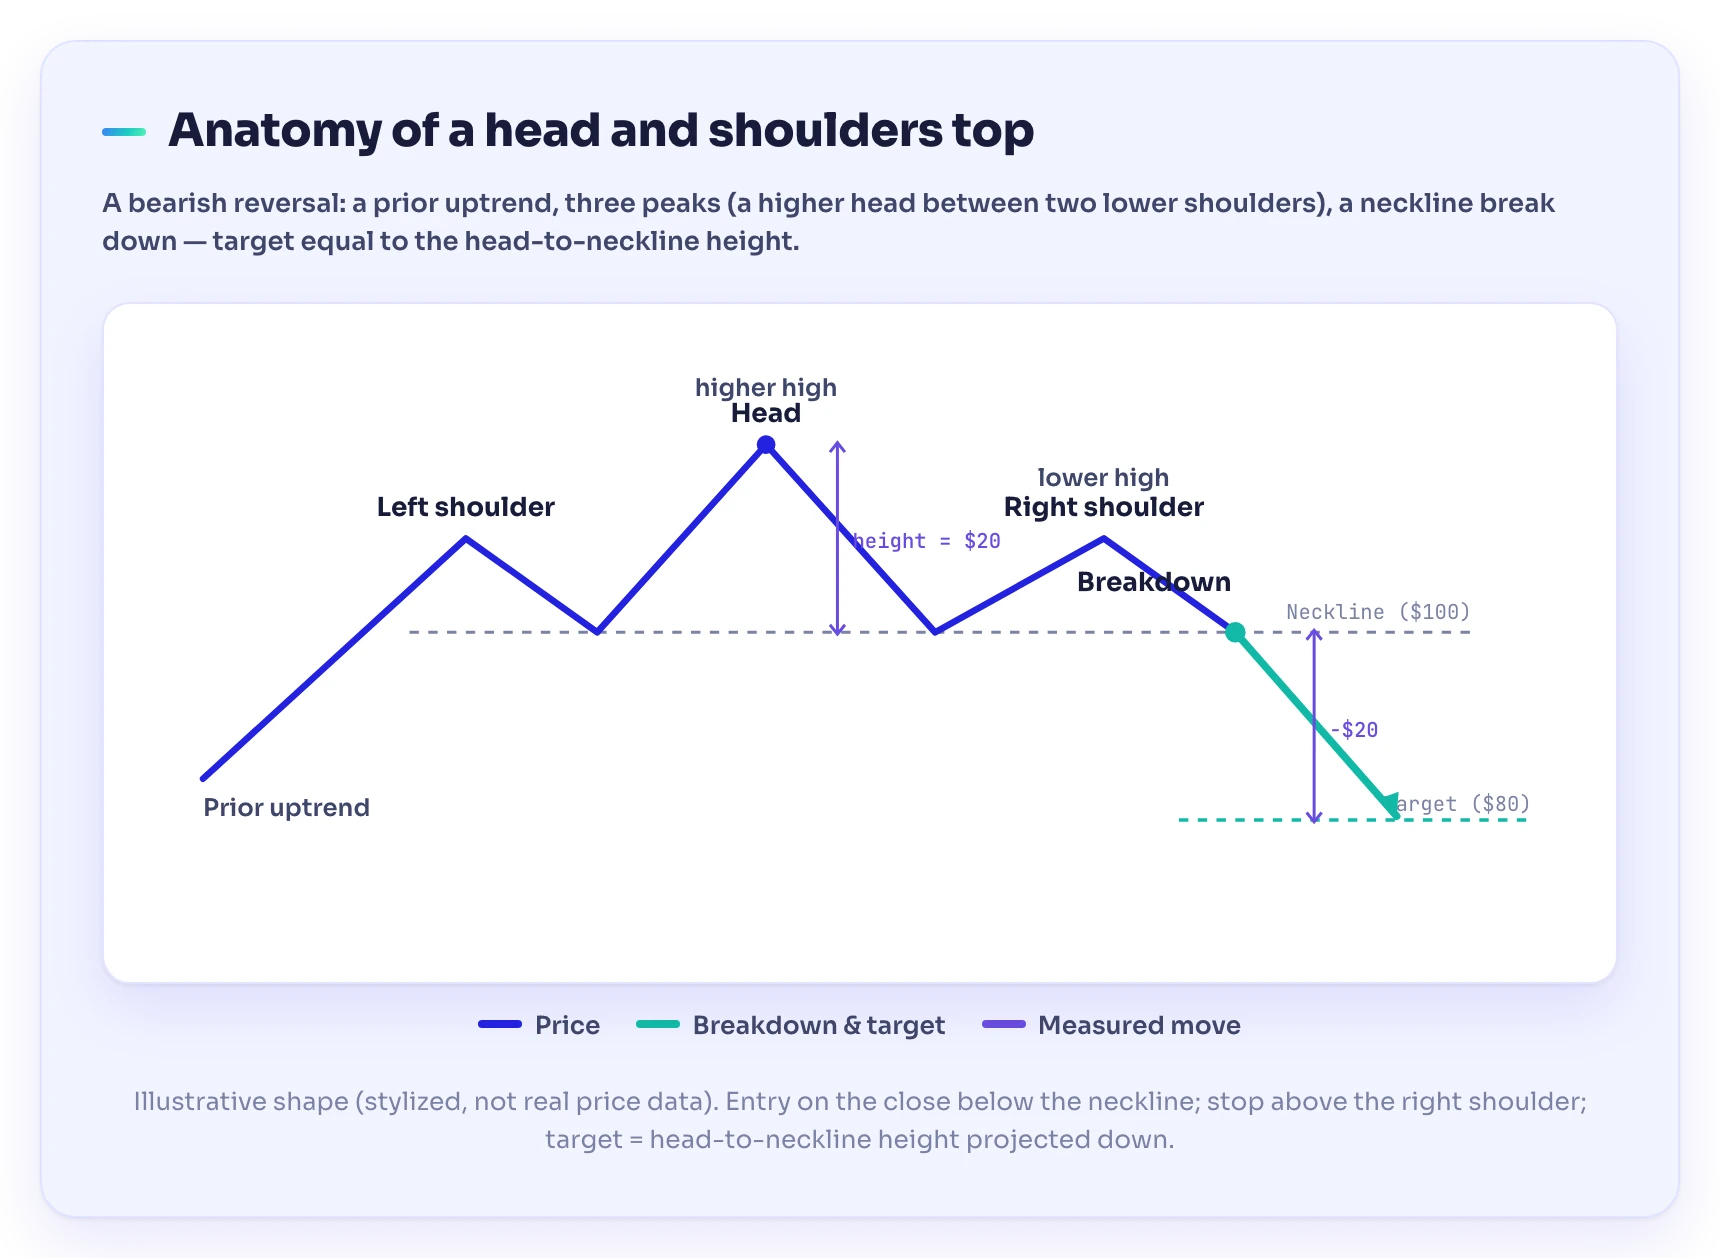
An illustrative head and shoulders top: a prior uptrend, a left shoulder, a higher head, a lower right shoulder, a neckline drawn across the two lows, then a break below the neckline with a target equal to the head-to-neckline distance. Stylized shape for teaching — not real price data.
The shape:
- A clear prior uptrend must exist. A reversal needs something to reverse. Three bumps in a sideways range are not a valid pattern — they are noise.
- The head is the highest peak. The middle peak must be visibly higher than both shoulders, or you don’t have the pattern.
- The right shoulder is lower than the head — and ideally near the height of the left shoulder. A right shoulder that matches or exceeds the head means buyers are still in control.
Symmetry:
- The two shoulders should be roughly balanced in height and width, ideally within about 10–15% of each other. Rough symmetry is a sign of an orderly, tradable pattern; wildly lopsided “shoulders” are usually forced interpretations. (In Bulkowski’s ranking the top scores 9 of 36 for overall performance, and he finds that setups where the left shoulder sits a little higher tend to perform slightly better after the break — but near-symmetry is the baseline to look for.)
The neckline and volume:
- The neckline is your trigger line. Draw it across the two reaction lows on either side of the head. Nothing is confirmed until price closes below it — everything before that is a forming pattern, not a signal.
- Volume should fade across the three peaks. Healthy: strong volume on the left shoulder, lighter on the head, lightest on the right shoulder. That declining participation is the hidden confirmation that demand is drying up.
- Volume should expand on the neckline break. A breakdown on heavy volume — ideally 1.5 to 2 times the recent average — is far more reliable than one on thin volume, which is prone to snapping back within a bar or two.
How to trade the head and shoulders pattern
Once the pattern confirms, the trade has three mechanical parts: entry, stop, and target.
1. Entry — the neckline break. The trigger is a decisive close below the neckline, ideally on rising volume. To filter false breaks, many traders borrow the Edwards and Magee 3% rule — requiring price to close at least 3% beyond the neckline before acting. Two styles:
- Breakdown entry: enter (sell/short, or exit a long) as price closes below the neckline. Simplest, but occasionally catches a false break.
- Retest entry: wait for the break, then for price to pull back up to the neckline — which now acts as resistance — and stall. Lower risk, but you sometimes miss the move. Bulkowski’s research finds a pullback to the neckline happens roughly 68% of the time — so a patient retest entry sets up in about two of every three confirmed patterns, not as a rarity.
2. Stop-loss. Place the stop above the right shoulder (for a short). If price climbs back above the right shoulder, the reversal thesis has failed and there is no reason to stay in. This keeps the risk small and defined.
3. Target — the measured move. The standard head-and-shoulders target is the height of the pattern projected down from the neckline break. Measure the vertical distance from the top of the head down to the neckline, then subtract that same distance from the point where price breaks the neckline.
A worked example (illustrative): Suppose a stock rallies to a left-shoulder high of $110, dips to $100, pushes to a head of $120, falls back to $100 again, then makes a lower right-shoulder high of $110 before rolling over. The neckline sits at $100, and the head-to-neckline height is $20.
- Entry: ~$100 on the close below the neckline.
- Stop: just above the $110 right-shoulder high — about $10, or 10%, of risk.
- Target: $100 − $20 (pattern height) = $80, a $20 (20%) potential move.
That’s roughly $20 of reward against $10 of risk — a 2:1 reward-to-risk ratio, or 2R, if the pattern plays out. It often won’t, which is why the stop is non-negotiable. In Bulkowski’s sample of 2,800-plus trades, only about 51% of confirmed patterns reached their full measured target and the average decline ran near 16%, so treat the projection as a guide, not a promise.
The inverse head and shoulders (the bullish version)
The inverse head and shoulders — also called a head and shoulders bottom — is the mirror image: a bullish reversal pattern that appears at the end of a downtrend.
- It forms three troughs instead of peaks: a left shoulder, a lower head, and a higher right shoulder.
- The neckline is drawn across the two highs between the troughs and acts as resistance.
- The signal is a breakout above the neckline, not a break below it.
- The target is the same idea flipped: measure the distance from the head (the lowest low) up to the neckline, then project that distance upward from the breakout, with a stop just below the right shoulder’s low. Flip the earlier example — a head at $80 under a neckline at $100 projects a target near $120, a $20 (25%) move up.
Traders use the inverse version to time long entries or to exit shorts, particularly when a falling market is trying to bottom. The volume logic is identical: you want volume expanding on the breakout above the neckline. Bulkowski ranks the inverse bottom similarly to the top, with a comparable pullback rate near 68%.
Common mistakes and why the pattern fails
Watch for traps: No pattern is a guarantee, and this one fails often enough to respect. In Bulkowski’s data the head-and-shoulders top carries a break-even failure rate near 19% even after a valid neckline break, and only about 51% of confirmed patterns reach their full measured target. A clean shape improves the odds; it never removes the risk — which is why the stop above the right shoulder is non-negotiable.
The usual culprits:
- Trading before the neckline breaks. A shape that looks like the pattern is not a signal until price closes below the neckline. Selling on the right shoulder is guessing — the pattern frequently never confirms and price marches higher.
- No prior trend. Three peaks inside a sideways range have no trend to reverse. Without a real uptrend before it, there is no pattern.
- A right shoulder that’s too high. If the third peak matches or tops the head, buyers still have control. That’s not a valid right shoulder.
- Ignoring volume. A neckline break on weak volume is the classic trap; without sellers behind it, price often reclaims the neckline and squeezes shorts.
- No stop-loss. The entire edge depends on cutting the trade when price climbs back above the right shoulder. One un-stopped failed pattern can erase several winners.
- Forcing symmetry. If you have to squint to see two balanced shoulders, it probably isn’t there. The cleanest patterns don’t need convincing.
For a side-by-side of this and the other formations — including the bullish cup and handle pattern — keep our chart patterns cheat sheet open while you chart.
Does the head and shoulders work in forex and crypto?
Yes — the pattern is market-agnostic. It reflects universal crowd behavior (a trend, a failed push, then a reversal), so it appears on any liquid, chart-able market:
- Stocks — its most-studied home; works well on daily and weekly charts of trending equities on the New York Stock Exchange and Nasdaq — think large caps in the S&P 500, the kind of names Edwards and Magee drew their original examples from.
- Forex — common across major and minor pairs like EUR/USD and GBP/USD; traders often watch the 4-hour and daily timeframes, where the neckline is cleaner than on a 5- or 15-minute chart.
- Crypto — appears on Bitcoin, Ethereum, and larger altcoins, though 24/7 markets and higher volatility produce messier shoulders and more false neckline breaks, so volume confirmation and a tight stop matter even more.
The rules don’t change by asset — only the volatility does. On faster, noisier markets, demand cleaner symmetry and stronger breakdown volume before you act.
Frequently asked questions
Is the head and shoulders bullish or bearish?
The standard head and shoulders (a “top”) is bearish — a reversal pattern that signals an uptrend is ending and a downtrend may follow once the neckline breaks. The inverse head and shoulders (a “bottom”) is its bullish counterpart, signaling a downtrend may be reversing higher.
How reliable is the head and shoulders pattern?
It is one of the better-regarded reversal patterns, but no chart pattern is a sure thing. In Thomas Bulkowski’s study of more than 2,800 trades, the head-and-shoulders top had a break-even failure rate of about 19% and an average decline of about 16% once confirmed — solid for a reversal, but far from automatic. Reliability improves with a clear prior trend, fading volume across the peaks, expanding volume on the break, and a disciplined stop-loss.
What is the neckline in a head and shoulders?
The neckline is the support line drawn across the two reaction lows on either side of the head (or the two highs, for an inverse pattern). It is the trigger: the pattern is only confirmed when price closes through the neckline.
How do you set a price target on a head and shoulders?
Measure the vertical distance from the top of the head down to the neckline, then project that same distance down from the point where price breaks the neckline. If the head is $20 above the neckline and the break happens at $100, the target is about $80. The inverse pattern projects the distance upward.
Where do you put the stop-loss?
Just above the right shoulder for a bearish top (or just below the right shoulder for an inverse bottom). If price moves back past the right shoulder, the pattern has failed and the trade should be closed.
What is an inverse head and shoulders?
A bullish mirror image that forms at the bottom of a downtrend: three troughs (a left shoulder, a lower head, a higher right shoulder) under a neckline of resistance, completed by a breakout above the neckline. The target projects the head-to-neckline distance upward.
Keep leveling up
This reversal is one pattern in a much larger playbook. The fastest way to internalize it is to mark up live charts, watch the right shoulder form in real time, and paper-trade the neckline break across 10 or 20 setups before risking real money.
Practice before you risk it: Learning alongside a trading community or academy like TradeGATEHub — where you can compare setups and pressure-test your reads against other traders — tends to beat studying in isolation. Start with the full chart patterns cheat sheet, then explore the rest of the TradeGATEHub Academy.
Sources
- Bulkowski, T. N. Head-and-Shoulders Tops — statistics from more than 2,800 trades: 19% break-even failure rate, 16% average decline, 68% pullback rate, 51% meeting the price target, and the height-projected measure rule. Overall performance rank 9 of 36. thepatternsite.com
- Bulkowski, T. N. Encyclopedia of Chart Patterns (Wiley) — the reference work behind the pattern’s statistics, symmetry findings, and measure rule. thepatternsite.com
Risk warning. Trading stocks, forex, and CFDs carries a high level of risk and may not be suitable for all investors. Chart patterns, including the head and shoulders, are educational tools, not trading signals, and do not guarantee results. Past performance and illustrative examples do not predict future outcomes. This article is for educational purposes only and does not constitute financial advice.