



The RSI indicator in forex is the relative strength index applied to currency pairs — a 0–100 momentum oscillator that measures how fast and how far a pair has moved recently. In forex it does the same job as anywhere else, but the way you read it changes: currencies trend hard, run 24 hours across sessions, and spike on news, so the classic 70/30 rules need adjusting.
If you want the mechanics — how the RSI is calculated, what overbought and oversold mean, and Wilder’s 14-period default — start with our full guide to the RSI indicator. This post assumes you know the basics and focuses on one thing: how to apply the RSI to the forex market specifically, where session-driven liquidity, strong directional trends, and news-driven volatility all bend the standard signals.
Why the RSI behaves differently in forex
The RSI formula is identical on a EUR/USD chart and an Apple chart. What differs is the market underneath it.
Forex is the largest and most liquid market in the world: the Bank for International Settlements measured daily currency turnover at roughly $7.5 trillion in its April 2022 Triennial Survey. That depth has three consequences for how the RSI reads.
- Currencies trend for long stretches. Interest-rate differentials and central-bank policy can push a pair the same direction for weeks. In a strong trend the RSI can sit “overbought” or “oversold” far longer than a beginner expects.
- The market runs around the clock. FX trades continuously from the Monday Asian open to the Friday New York close, so momentum resets with each session rather than each daily bar. An RSI reading at the Tokyo open often means something different by the London–New York overlap.
- News moves price in seconds. Rate decisions, CPI prints and payrolls can spike a pair violently, throwing the RSI to an extreme that reverts almost as fast.
Momentum, Not Direction: The RSI does not tell you which way a currency pair will go. It measures the force behind the current move — whether the recent push has been unusually strong or weak relative to the pair’s own history. In forex, where trends persist, that distinction is the whole game: strong momentum in a trend is a reason to stay with it, not to fade it.
Session-driven momentum: read the RSI in context
Because forex liquidity concentrates in a few centres, momentum is not spread evenly across the day. The BIS survey found that sales desks in just five jurisdictions — the United Kingdom, the United States, Hong Kong, Singapore and Japan — handled 78% of all FX trading, with the UK alone at 38% of global turnover.
In practice that means the London and New York sessions carry most of the real momentum, and the London–New York overlap (roughly 13:00–16:00 UTC) is where the cleanest RSI moves on the majors tend to form. A few habits follow from that:
- Treat an RSI extreme printed in a thin session (late New York, early Asia) with more suspicion — low liquidity produces jumpy, less reliable readings.
- Expect momentum to build into the London open and the overlap. An RSI crossing back above 50 as London comes online is a stronger trend signal than the same cross at 03:00 UTC.
- Re-anchor your view each session. Yesterday’s oversold on the 1-hour chart may be irrelevant once a new session brings fresh order flow.
The 50 line: your forex trend filter

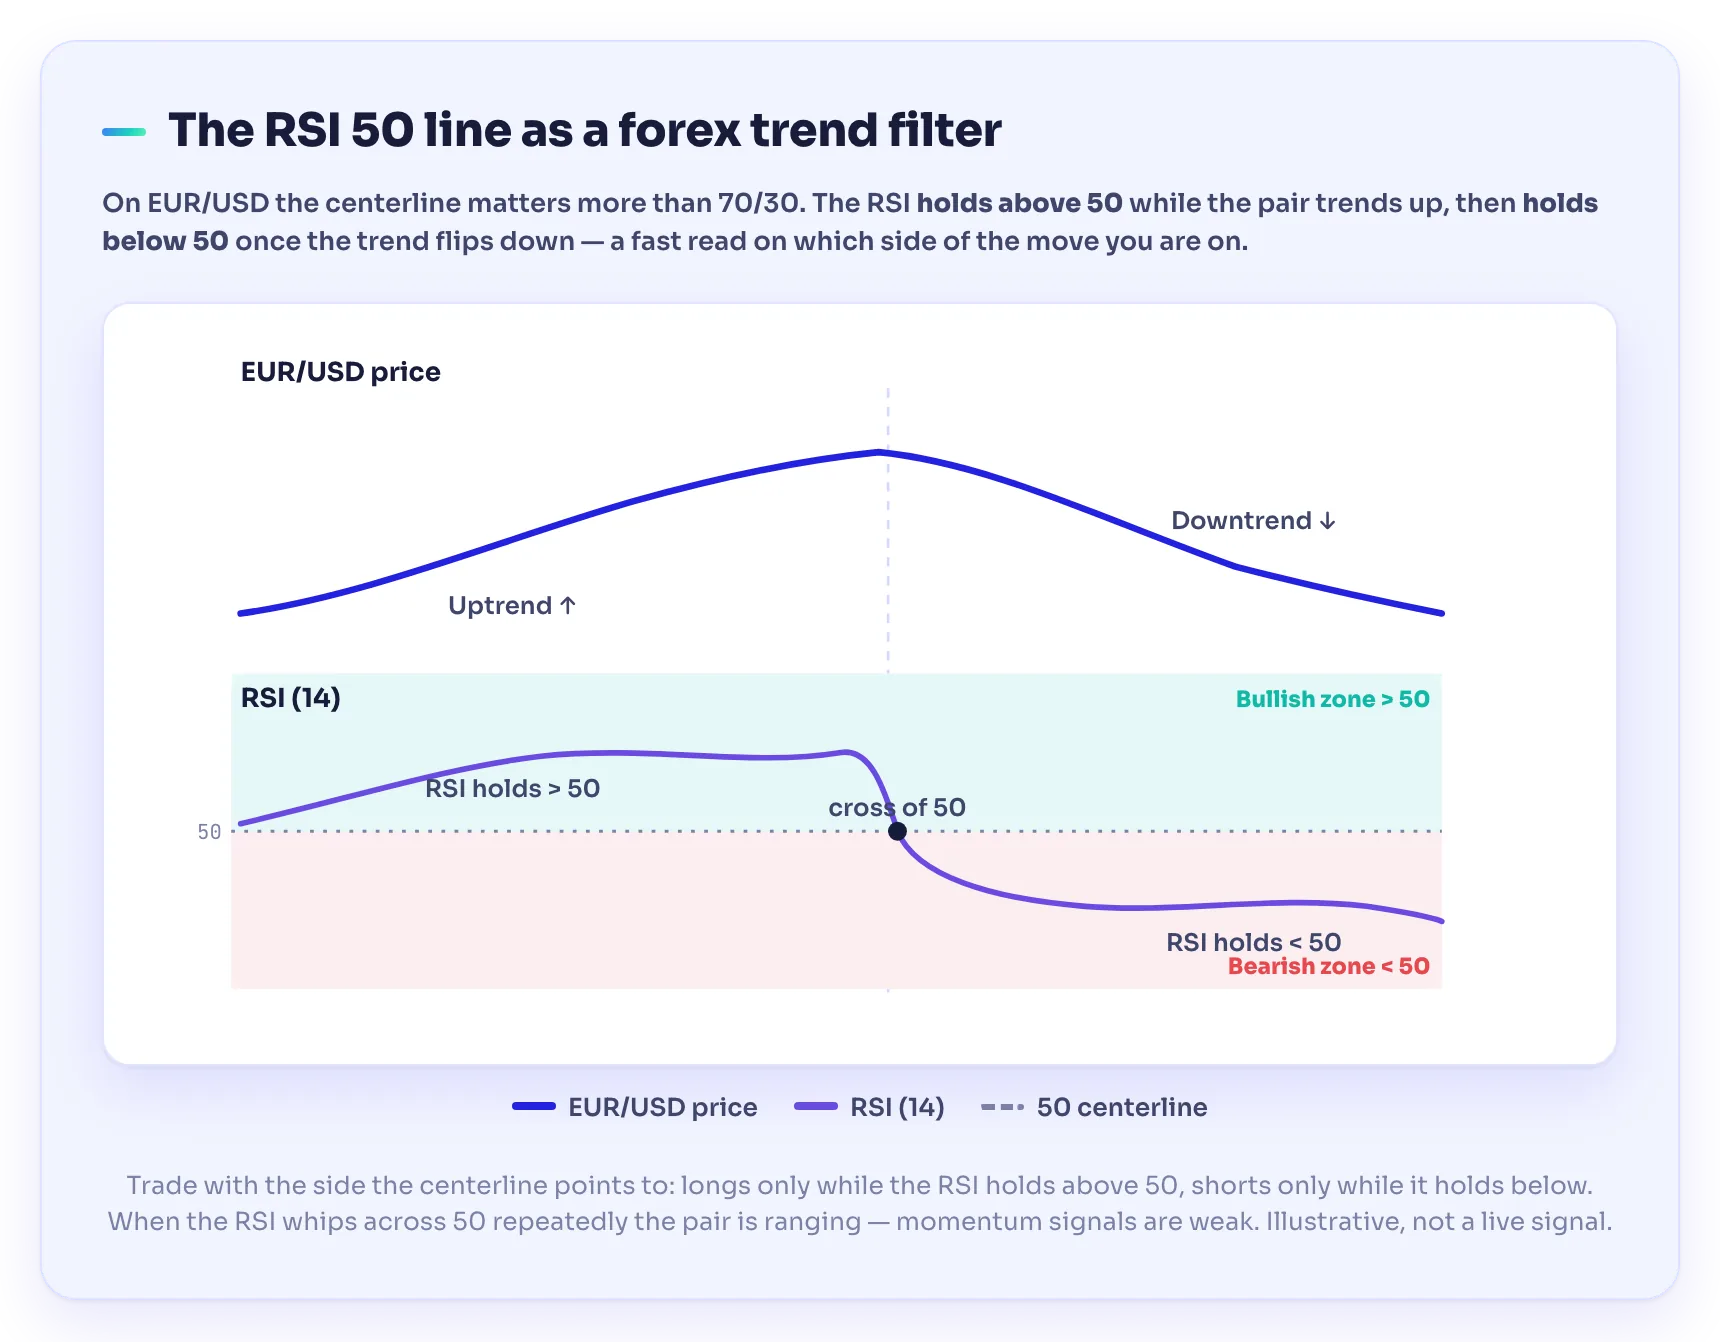
The single most useful RSI level in forex is not 70 or 30 — it is 50. Because the RSI sits above 50 when average gains beat average losses and below 50 when they don’t, the centerline is a clean, fast read on which side of the trend you’re on.
Many currency traders use it as a filter rather than a trigger:
- RSI holding above 50 → the pair is in bullish momentum; look for long setups only, and treat dips toward 40–50 as potential trend-resumption entries rather than tops.
- RSI holding below 50 → bearish momentum; look for short setups, and treat bounces toward 50–60 as potential continuation entries rather than bottoms.
- RSI whipping across 50 repeatedly → no clear trend; the pair is ranging, and momentum signals are weak. This is the RSI telling you to stand aside or switch to range tactics.
This centerline discipline pairs naturally with structure work like supply and demand zones — the RSI confirms momentum, the zone marks where to act.
The 50-Line Rules the Trend: In forex, use the RSI 50 level as a momentum filter and 70/30 as alerts, not orders. Trade in the direction the centerline points, wait for price confirmation, and let strong trends run instead of fading every “overbought” print. The centerline keeps you on the right side of a trending pair.
Why 70/30 behaves differently in strong FX trends
On a ranging pair, the classic rules work reasonably well: RSI above 70 flags a stretched up-move, below 30 flags a stretched down-move. But forex trends are powerful, and that is exactly where beginners get hurt.
In a strong uptrend, the RSI can stay pinned above 70 for many candles while the pair keeps climbing. Anyone who shorts the first “overbought” reading is fighting the dominant flow. Analysts who study the RSI closely describe this as a bull-market range: in a healthy uptrend the RSI tends to oscillate roughly between 40 and 80, using ~40 as support rather than dropping to 30. In a downtrend it inverts — a bear-market range of roughly 20 to 60, with ~60 acting as resistance.
Overbought Is Not a Sell Signal: Technical analysis is probabilistic, not predictive — no indicator forecasts price, and the RSI is no exception. In forex specifically, “overbought” on a trending major is often a sign of strength, not a top. During strong rate-driven trends the RSI can hold above 70 for days. Fading it because it “should” reverse is one of the most reliable ways to lose money in currencies. Adjust your thresholds to the trend, or wait for price itself to confirm a turn.
The practical fix is to let the trend set the thresholds. In an established uptrend, watch the ~40 zone for buys and stop treating 70 as a sell. In a downtrend, watch the ~60 zone for sells and stop treating 30 as a buy. Only in a genuine range do the textbook 70/30 levels earn their keep.
Divergence around news and session spikes
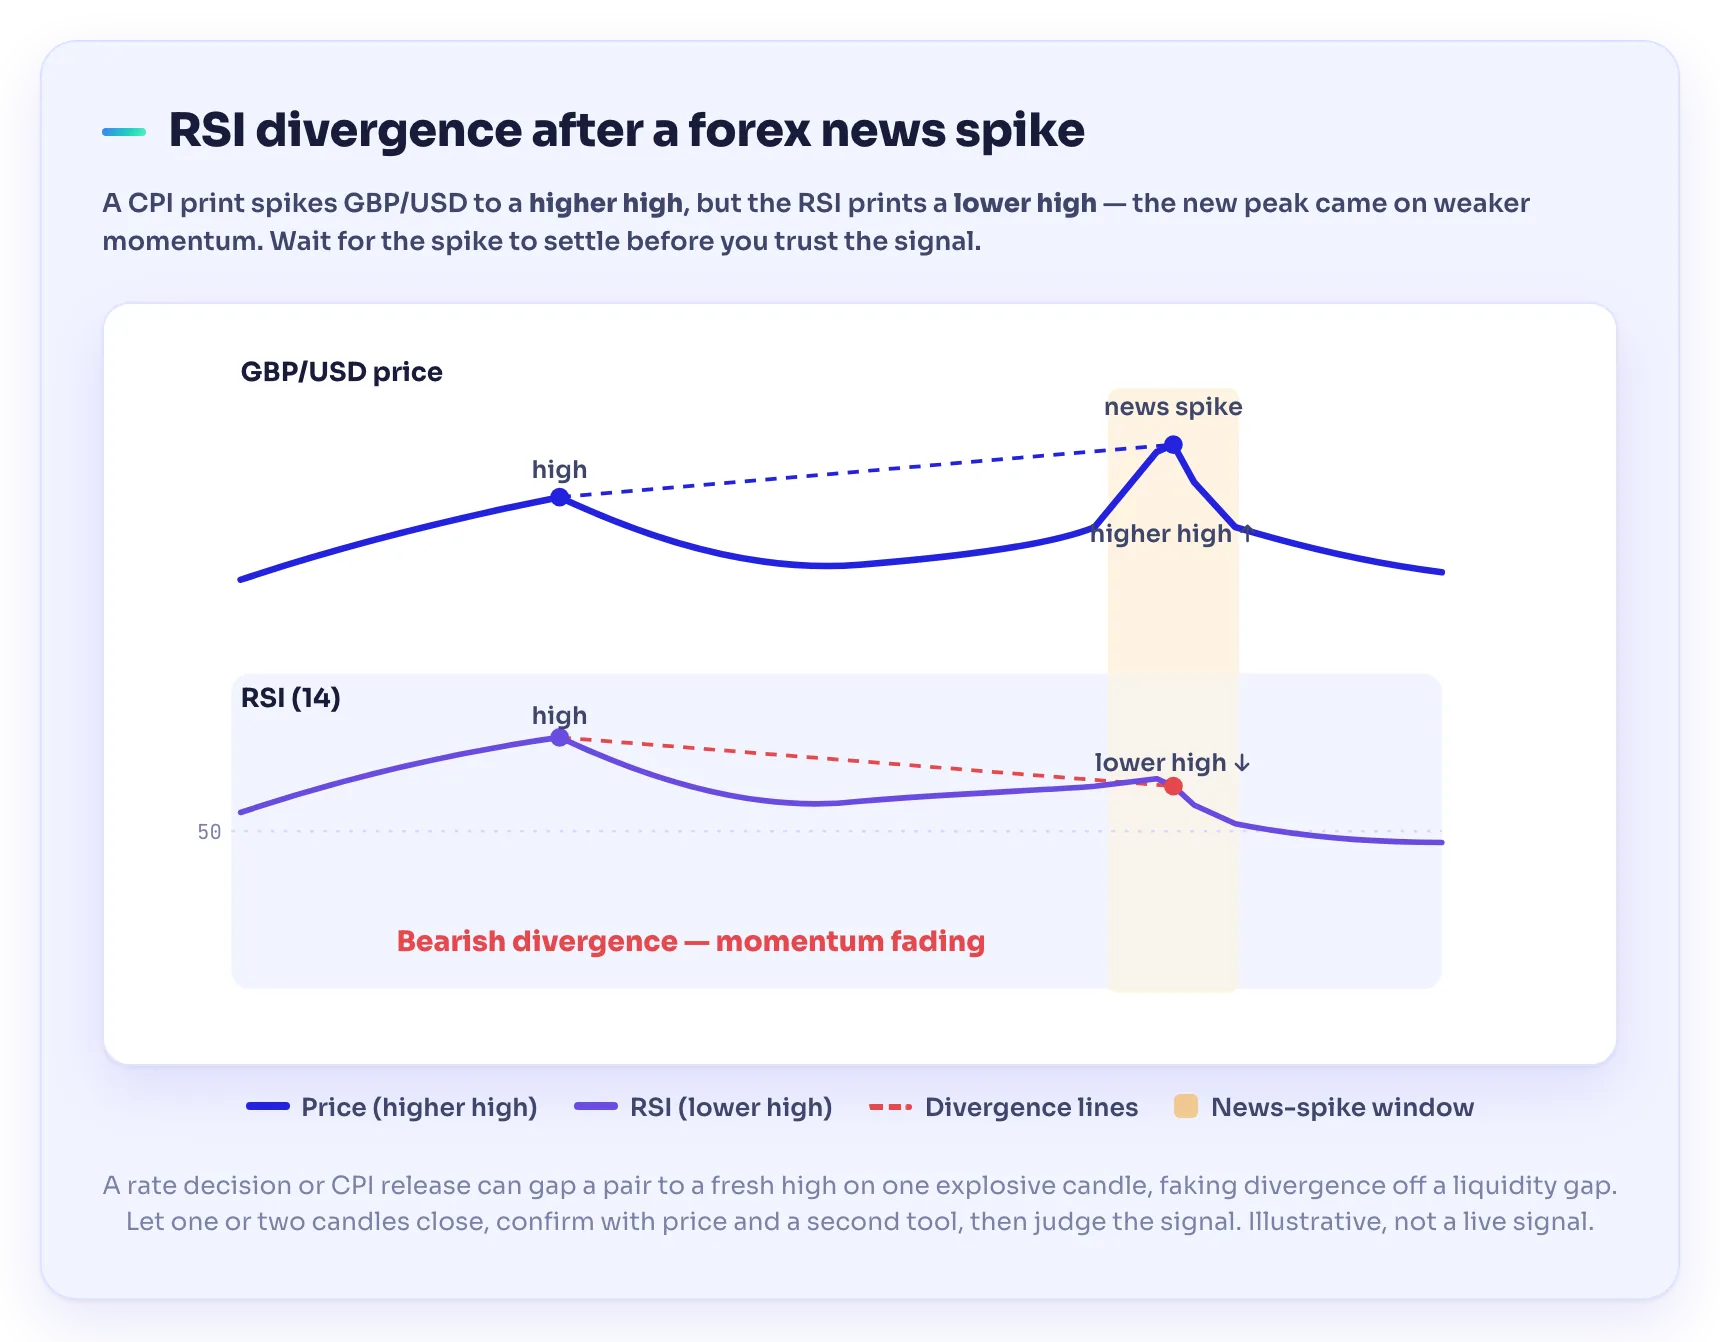
Divergence — price and the RSI disagreeing — is the RSI’s highest-quality signal, and it has a particular flavour in forex.
- Bearish divergence: the pair makes a higher high, but the RSI makes a lower high. The new peak came on weaker momentum — the up-move is tiring.
- Bullish divergence: the pair makes a lower low, but the RSI makes a higher low. Sellers are exhausting even as price drips down.
News spikes are where forex divergence gets tricky. A rate decision or CPI release can drive a pair to a fresh high on a single explosive candle, printing an RSI reading that looks like divergence when it is really just a liquidity gap. The disciplined approach is to wait for the spike to settle, let one or two candles close, and only then judge whether momentum genuinely diverged. Combining the RSI with a second momentum tool such as the MACD indicator helps filter the false readings that news bars produce.
A EUR/USD Session Read (Illustrative): Suppose EUR/USD trends up all through London, with the RSI riding between 55 and 78 — a textbook bull-market range. At the New York open a CPI beat spikes price to a new high, but the RSI prints 72, below its earlier 78. That is potential bearish divergence: the new high came on weaker momentum. A trader does not short immediately — they wait for price to close back below the spike candle’s midpoint and lose the 50 line before considering an exit or a countertrend entry. (Numbers are illustrative, not a live signal or a recommendation.)
Best RSI settings for forex
The default 14 periods with 70/30 levels is still the sensible starting point in forex — it is what most of the market watches, which is part of why it works. Adjust only with a reason:
| Setting | Effect | Who it suits |
|---|---|---|
| RSI 14 (default) | Balanced; widely watched | Most FX traders, swing and intraday |
| RSI 7–9 | Faster, more signals, more noise | Scalpers on M1–M15 during active sessions |
| RSI 21–25 | Smoother, slower, fewer false signals | Swing/position traders on H4–D1 |
| Bands 80/20 | Filters weak signals in trends | Trending majors, trend-following |
| Bands 40–80 / 20–60 | Matches bull/bear-market ranges | Traders reading trend context directly |
There is no universal “best” setting. Change one variable at a time, and confirm it on a demo before you trust it — over-tuning the lookback to make past trades look perfect (curve-fitting) rarely survives live markets.
Common RSI mistakes in forex
- Fading a strong trend on an “overbought” print. The classic account-killer in currencies. Rate-driven trends can hold the RSI above 70 for days.
- Trusting extremes in thin sessions. An RSI signal at 03:00 UTC on a minor pair carries far less weight than one during the London–New York overlap.
- Reading divergence off a raw news spike. Let the volatility settle before you judge momentum.
- Using one setting for every pair. A calm pair and a volatile one behave differently; the same RSI thresholds will not fit both.
- Ignoring the psychology. An oversold pair feels like a bargain and an overbought one feels like a top — the exact emotional pull that traps traders. Our notes on trading psychology pair naturally with momentum work.
- Trading the RSI alone. It is a second opinion, not a system. Combine it with trend, structure and a confirming tool before you act. See how the RSI fits the wider toolkit in our overview of technical analysis.
Level Up: If you want to practise reading the RSI on live currency charts before you risk real money, a structured, community-led academy like TradeGATEHub — with free trading education and a live academy — is a low-pressure place to build the reps.
Frequently asked questions
How do you use the RSI indicator in forex?
Use the RSI on currency pairs as a momentum filter, not a buy/sell button. Watch the 50 line to gauge trend direction (longs above 50, shorts below), treat 70/30 as alerts rather than orders, and look for divergence between price and the RSI. Always confirm with price action and a second tool.
What are the best RSI settings for forex?
The default 14 periods with 70/30 levels is the standard and a solid starting point. Scalpers may shorten the lookback to 7–9 for faster signals; swing traders may lengthen it to 21–25 for smoother ones. Many trend traders widen the bands to 80/20 on trending majors. Test any change on a demo first.
Why does the RSI stay overbought in forex trends?
Because currency trends, often driven by interest-rate differentials, are strong and persistent. In a healthy uptrend momentum stays elevated, so the RSI can hold above 70 for many candles while price keeps rising. That is a sign of strength, not an automatic sell signal — fading it is a common, costly mistake.
Does the RSI work on all currency pairs?
The RSI plots on any pair, but it reads best on liquid majors during active sessions. On thin minors or exotics, and in quiet hours, low liquidity produces jumpy, less reliable readings. Reserve your highest confidence for signals formed during the London and New York sessions.
What is RSI divergence in forex?
Divergence is when price and the RSI move in opposite directions. Bearish divergence is a higher price high with a lower RSI high; bullish divergence is a lower price low with a higher RSI low. It warns of fading momentum, but around news spikes you must wait for the volatility to settle before trusting it.
Which RSI level matters most in forex?
The 50 centerline. The RSI sits above 50 when buyers dominate and below 50 when sellers do, so it is a fast read on which side of the trend you are on. Many forex traders take only longs while the RSI holds above 50 and only shorts while it holds below, using 70/30 as secondary alerts.
Sources
- Bank for International Settlements — OTC foreign exchange turnover in April 2022 (Triennial Central Bank Survey). Source for global FX turnover of ~$7.5 trillion per day and the concentration of trading in five centres (UK, US, Hong Kong, Singapore, Japan = 78%; UK = 38%). bis.org/statistics/rpfx22_fx.htm
- StockCharts ChartSchool — Relative Strength Index (RSI). Reference for Wilder’s formula (RSI = 100 − 100/(1 + RS)), the 14-period smoothed average gain/loss default, divergence signals, and the bull-market / bear-market RSI range concept (Constance Brown, Andrew Cardwell). chartschool.stockcharts.com
Risk warning. Trading forex and CFDs carries a high level of risk and may not be suitable for all investors. The RSI is an educational tool, not a trading signal, and does not guarantee results — overbought and oversold readings can persist in strong currency trends, and signals fail a meaningful share of the time. This article is for educational purposes only and does not constitute financial advice.