
Tag: tgh

Hometgh
Isometric bear-flag chart landscape with a learner avatar descending a steep downward flagpole toward a breakdown level

By TradeGATEHub Academy · Edited by Luke Vakasisikakala A bear flag is a bearish continuation chart pattern. A sharp, near-vertical drop forms the "flagpole," then a small, upward-drifting consolidation forms the "flag." When price breaks down below the flag, the prior downtrend is expected to resume — and the standard target is a move equal …


Isometric golden-cross chart landscape where a rising 50-day moving average crosses above a flat 200-day line toward a breakout summit

A golden cross is a chart signal that forms when a shorter moving average — usually the 50-day — crosses above a longer one, usually the 200-day. Traders read it as confirmation that a downtrend has bottomed and a longer-term uptrend may be taking hold. Its mirror image, the death cross, is the 50-day crossing …

Niveles de retroceso de Fibonacci trazados en un gráfico de acciones, marcando la zona de retroceso del 38.2%, 50% y 61.8% tras un rally

Fibonacci retracement for stocks is a way to map where a share price might pause or reverse after a strong move. You draw the tool between a swing low and swing high, and it plots horizontal levels — mainly 38.2%, 50% and 61.8% — that mark potential support or resistance inside the pullback. They are …

The MACD (Moving Average Convergence Divergence) is a trend-following momentum indicator that tracks the relationship between two exponential moving averages of price. It plots three parts — the MACD line, a signal line, and a histogram — and traders read their crossovers and divergences to gauge shifts in a trend's direction and strength. The name …

tgh-chart-patterns-cheat-sheet-hero

A chart patterns cheat sheet is a quick-reference guide to the recurring shapes price makes on a chart — like head and shoulders, triangles and flags — and what each one tends to signal next. Chartists have named 50-plus formations, yet almost all sort into three families: reversal patterns that hint a trend is turning, …

Stock Trading Community for Smarter Market Decisions

Trading used to be a lonely journey. It took hours of research, many chart analyses, and hard choices. These decisions often felt like jumping into the unknown. Today, that situation has changed a lot. Modern traders are not isolated. They’re connected through vibrant spaces where strategies, market signals, and insights are openly shared. This is …

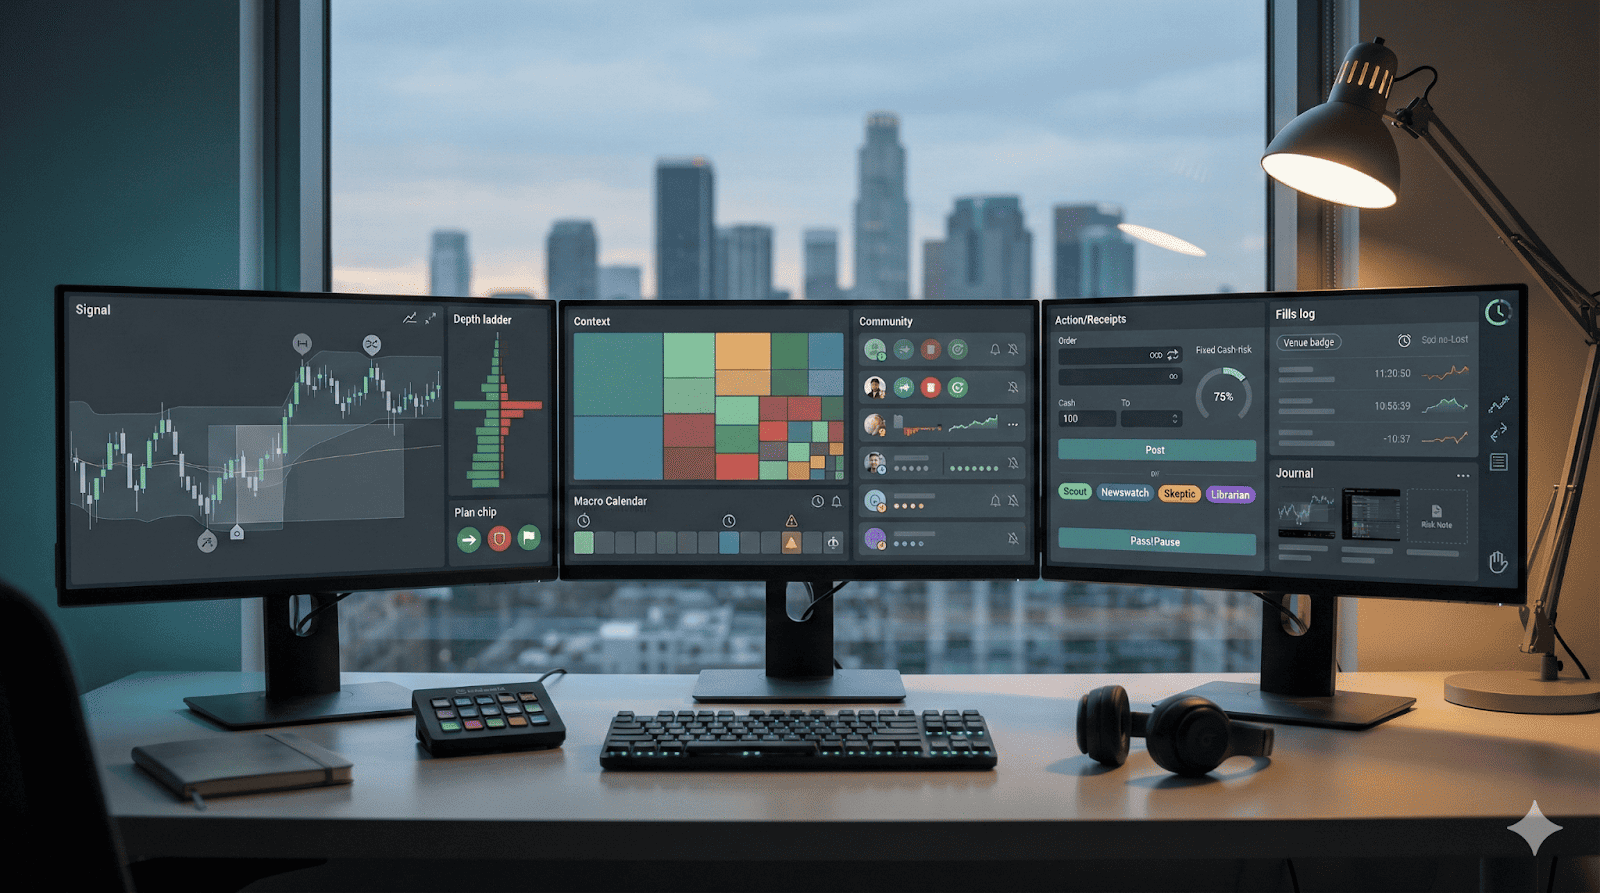
Signal Context Action Inside a Social Trading Platform

The opening is minutes away. Chat scrolls, charts twitch, and every idea feels urgent. A good social trading platform makes that noise useful by giving you three things in the same place: signal you can test, context you can trust, and actions you can execute without drama. “A post becomes a plan only when it …

A Practical Global Trading Academy That Fits Real Life

Most people do not quit trading because charts are “too hard.” They quit because the routine breaks. They watch a few videos, place a couple of impulsive trades, then get stuck: mixed signals, unclear rules, and a pile of tabs that never turns into a plan. A global trading Academy works best when it feels …

Best Live Trading Room Blueprint for Consistent Practice

Most traders don’t struggle because they “can’t read charts.” They struggle because they’re trading alone with no feedback loop. You take a setup, it works once, fails twice, and you can’t tell if the idea was wrong or the execution was sloppy. That’s why people go searching for the best live trading room: not for …