
Tag: tgh

Hometgh
Bollinger Bands wrapping a stock chart, tightening into a squeeze before an earnings gap and expanding on the breakout

Bollinger Bands on stocks are volatility envelopes — a 20-day moving average with an upper and lower band set two standard deviations away — that widen when a stock gets volatile and pinch tight when it goes quiet. For equity traders they do one job especially well: they flag the low-volatility "squeeze" that so often …
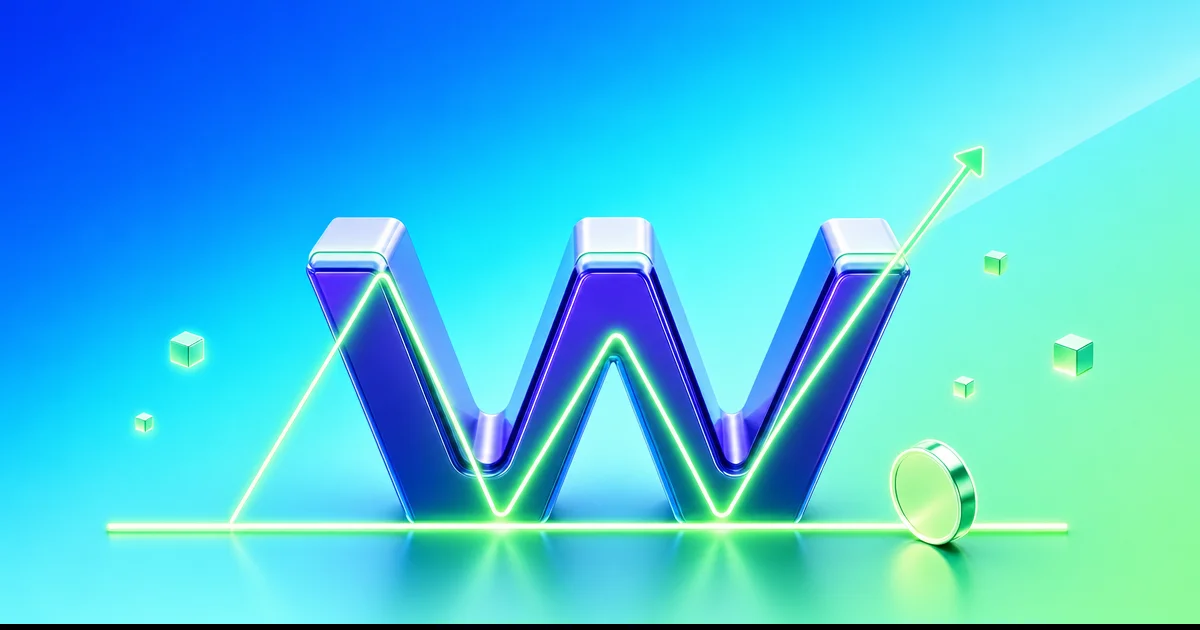
Double top pattern on a gold futures chart, two roughly equal peaks at resistance with the neckline support marked below

The double top pattern in commodities is a bearish reversal. It forms when a market like gold, crude oil, or natural gas rallies to a resistance level twice, fails both times at roughly the same price, and then breaks the support "neckline" between the two peaks. Two failures at one ceiling signal exhausted buyers — …

Indicador RSI graficado debajo de un gráfico de forex EUR/USD, oscilando entre zonas de sobrecompra y sobreventa a lo largo de una sesión de trading

The RSI indicator in forex is the relative strength index applied to currency pairs — a 0–100 momentum oscillator that measures how fast and how far a pair has moved recently. In forex it does the same job as anywhere else, but the way you read it changes: currencies trend hard, run 24 hours across …

Escena isométrica de progresión de una cuenta de trading financiada, con un avatar de trader escalando bloques de capital.

A funded trading account lets you trade a proprietary trading firm's capital instead of your own. You first pass the firm's evaluation, or "challenge," to prove you can trade within its rules. Once funded, you keep a share of the profits — often 70% to 90% — while the firm carries the risk. That is …

Mundo de gráfico isométrico de bandera alcista, con un avatar de estudiante escalando un asta de bandera empinada hacia la cima de la ruptura.

The bull flag pattern is a bullish continuation chart pattern. A sharp, near-vertical price surge forms the "flagpole," then a small, downward-sloping consolidation forms the "flag." When price breaks out above the flag, the prior uptrend is expected to resume — and the standard target is a move equal to the height of the flagpole. …

Mundo de juego isométrico de tres valles, con un avatar de estudiante resplandeciente leyendo una reversión de hombro-cabeza-hombro invertido desde el fondo del valle

The inverse head and shoulders is a bullish reversal chart pattern that marks the end of a downtrend. It forms three troughs — a left shoulder, a lower middle low called the head, and a higher right shoulder — sitting beneath a resistance line called the neckline. When price breaks above that neckline, the pattern …

Mundo montañoso isométrico de tres picos, con un avatar de estudiante iluminado interpretando una reversión de cabeza y hombros desde la cima.

The head and shoulders pattern is a bearish reversal chart pattern that marks the end of an uptrend. It forms three peaks — a left shoulder, a higher head, and a lower right shoulder — sitting on a support line called the neckline. When price breaks below that neckline, the pattern is confirmed and a …

A fair value gap (FVG) highlighted as a three-candle imbalance on a price chart

A fair value gap (FVG) is a three-candle price imbalance: the middle candle moves so fast that the first candle's wick and the third candle's wick never overlap, leaving a gap between them. Traders read this void as unfinished business — a price area the market often revisits before continuing. If you have ever seen …

Isometric cup-and-handle chart landscape with a learner avatar climbing toward a breakout summit

The cup and handle pattern is a bullish continuation chart pattern. Price forms a rounded, U-shaped consolidation (the cup), then a small downward drift (the handle), before breaking out above resistance to continue its prior uptrend. Traders enter on the breakout, targeting a move roughly equal to the cup's depth. It is one of the …